Revisiting “Educational Polarization: A White Phenomenon?” in the Wake of the 2024 Election
Tracking Democratic de-identification and vote attrition across racial groups.
As usual, you can find the code to replicate this analysis in a GitHub repository linked here.
Recent analysis by The New York Times1 declared that Democrats are facing a “voter registration crisis”: across states that track partisan voter registration, Democrats have lost ground in the share of voters affiliated with the party. Does this hold for the electorate writ large?
1 This is a gift link!
This also reminded me of a previous blog post. In 2021, I wrote a piece showing that while Americans without a college degree of all races were increasingly unlikely to identify as Democrats, educational polarization in vote choice was largely limited to white Americans. In 2024, is this still true? I revisit these questions using the cumulative CES Common Content dataset prepared by Shiro Kuriwaki.
The CES data reveals a consistent pattern: across all racial groups, Americans without college degrees identify less strongly as Democrats than their college-educated counterparts. Moreover, this education gap in Democratic identification has widened since 2020 for every racial demographic. Notably, non-college-educated Hispanic and Black Americans have shown steep increases in identification as Independents or with no particular party, a trend that has accelerated from 2020 to 2024. The headline finding is the same as the 2021 post: these voters are moving away from affiliating with the Democratic Party rather than toward the Republican Party.
The notable puzzle from the 2021 piece, though, was that the emerging degree divide in Democratic affiliation was not accompanied by a degree divide in presidential vote choice for Black and Hispanic voters. In 2024, however, there is evidence that the degree divide may finally be emerging when it comes to Black and Hispanic presidential vote choice.
Since 2012, Americans are less likely to identify as Democrats
To start, because partisan voter registration has a number of issues2 and because it always helps to consider trends in the aggregate, I plot general partisan identification for all American adults between 2008 and 2024. I also make one important analytical change from the 2021 piece: rather than just considering people who explicitly identify as Independents, I group Independents and those who opt not to identify with either the Democratic or Republican parties.3
2 A topic likely covered in detail elsewhere by more involved authors; these include the fact that not every state requires partisan registration, that voters often change their voting behavior before re-registering with the party, that some members in one party living in a safe state for their unfavored party might want to participate in that party’s closed primary, etc.
3 I think this is defensible for a number of reasons, primarily because the question used allows people to identify as leaning towards the Democratic or Republican Parties. As a result, the remaining respondents have made pronounced and conscious decisions to not identify with either party. This leads to some small changes in results for later plots.
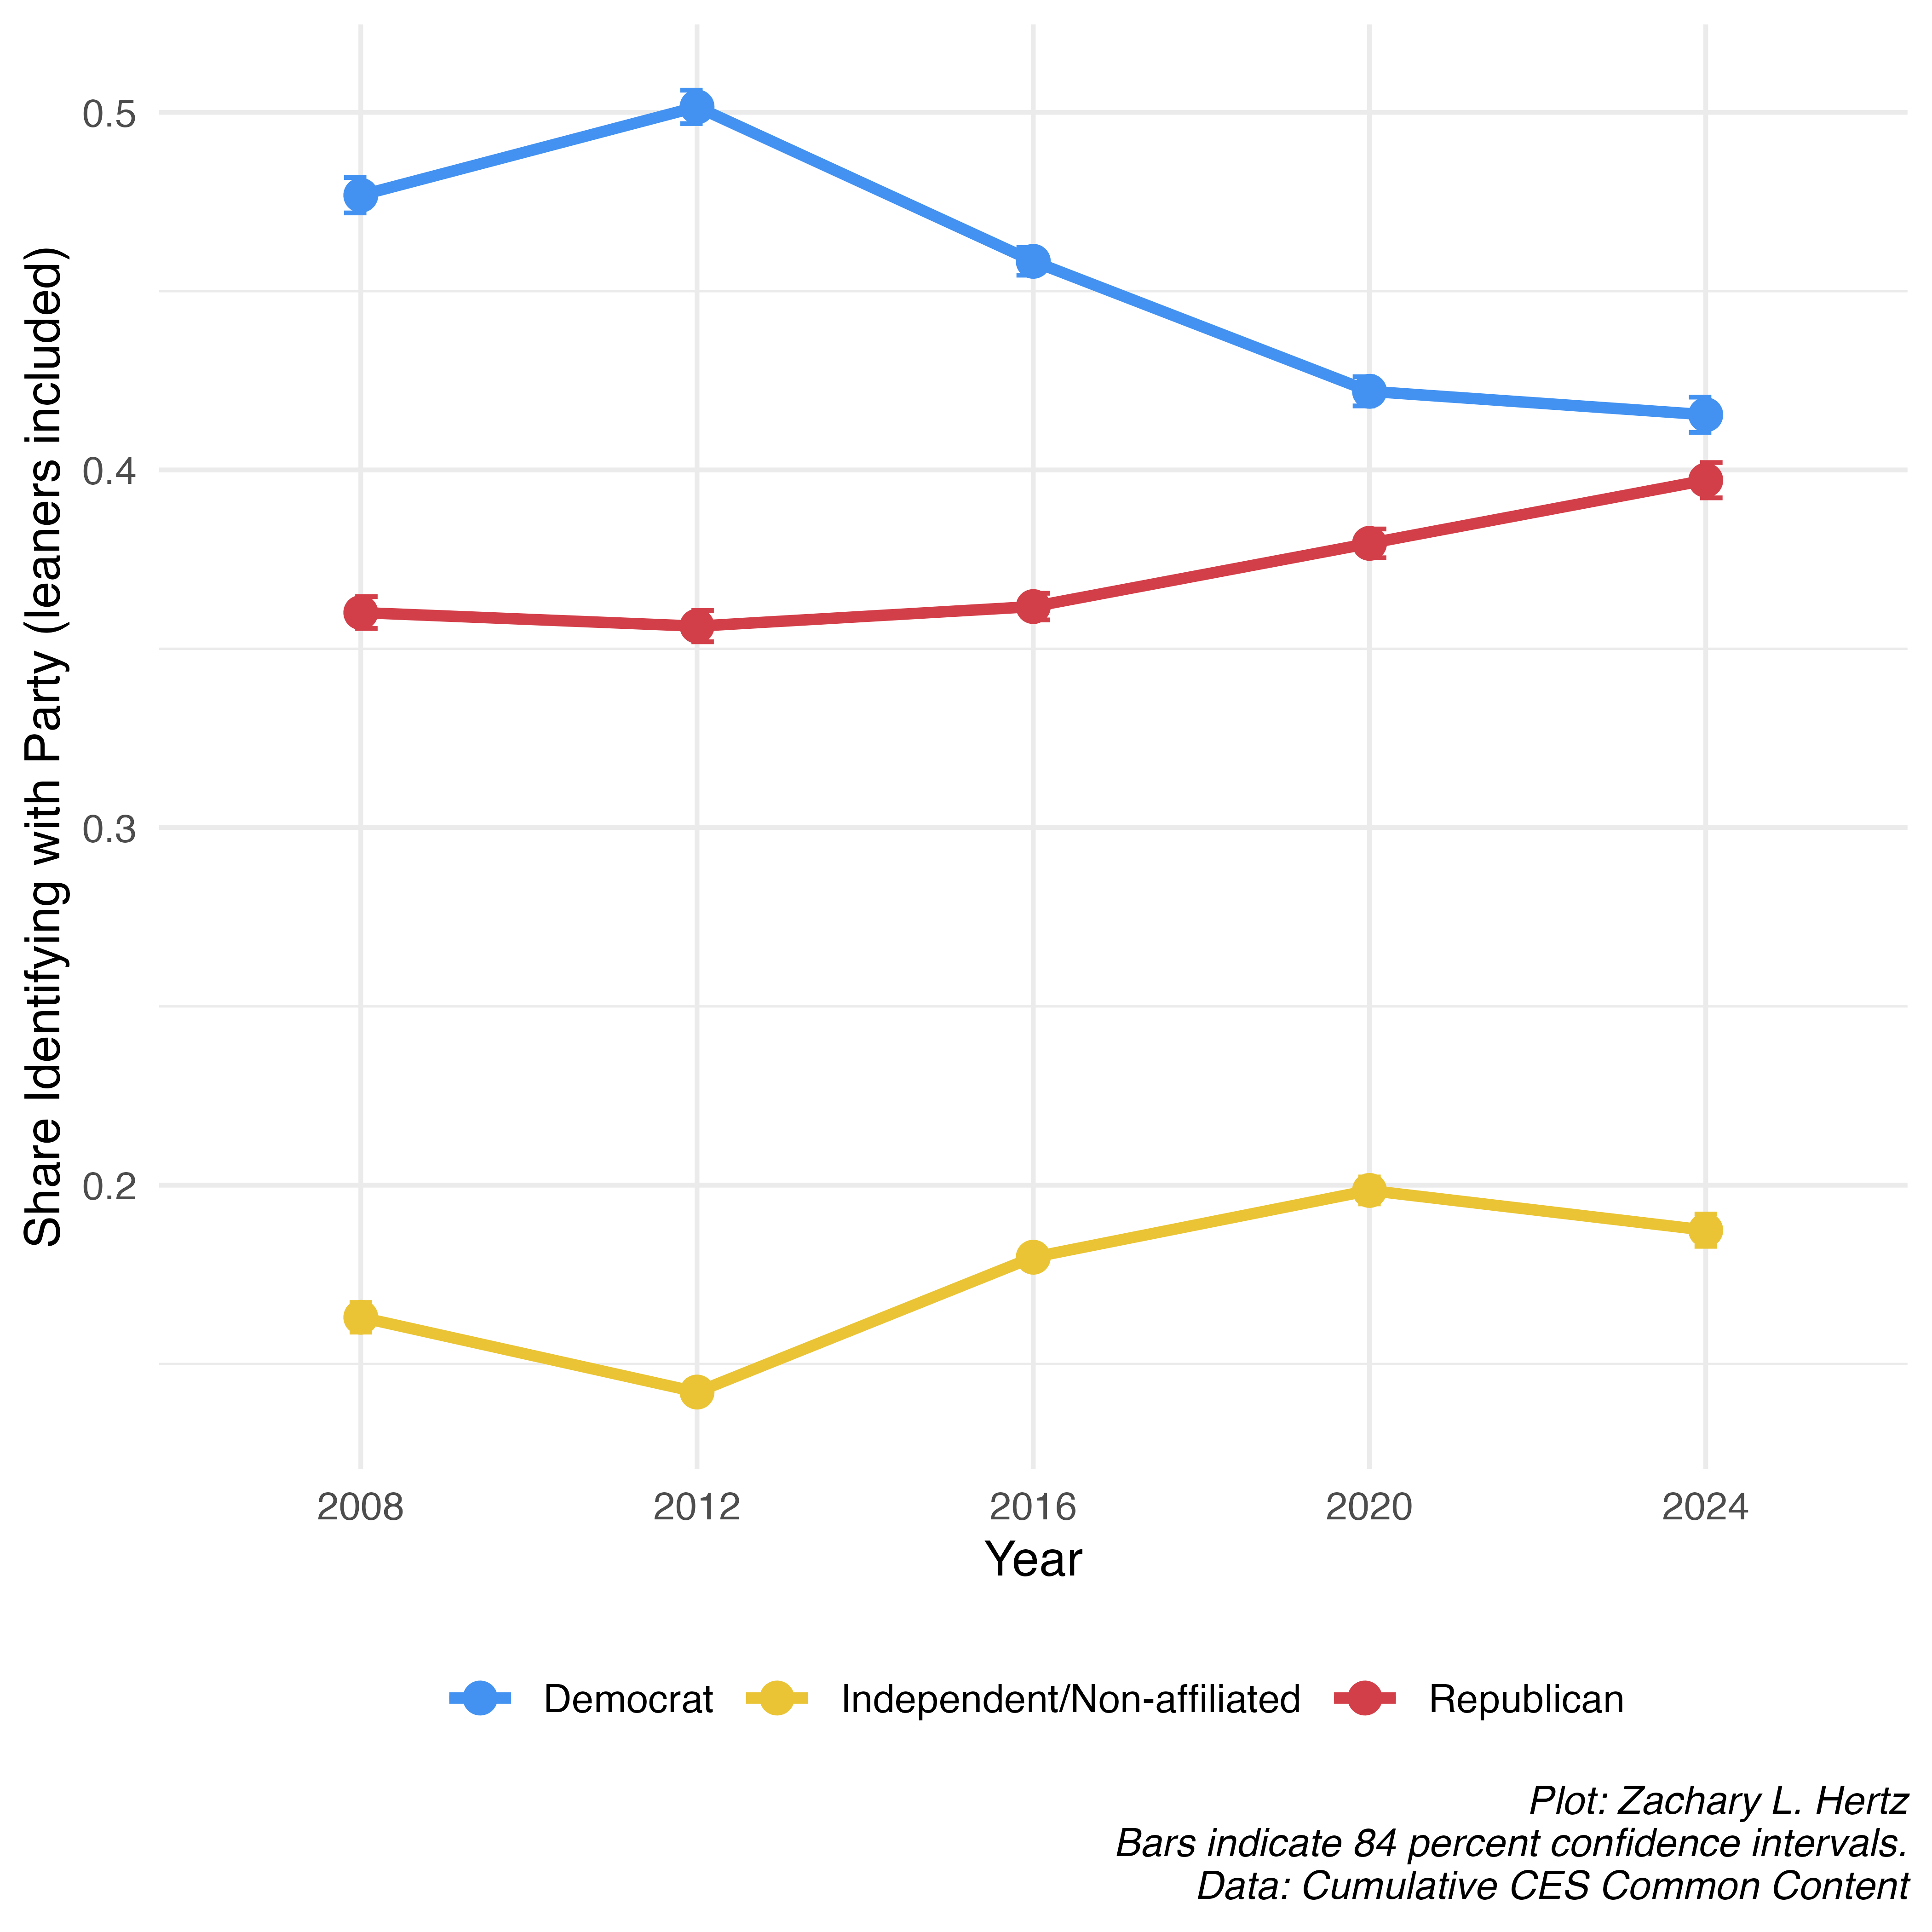
We can see that most notably, while in 2012 half of American adults identified with the Democratic Party, by 2024 just 41.5 percent identified as Democrats. In the same period, the share of adults identifying with the Republican Party grew from 35.6 to 39.7 percent. The share of adults who identified either as Independents or did not identify with the two major parties grew from 14.2 percent in 2012 to a peak of 19.9 percent in 2020, falling slightly in 2024 to 18.7 percent.
Since 2020, both Black and Hispanic Americans have undergone Democratic attrition and Republican affiliation
When breaking this out by race, we see a great deal of variation in the aggregate trends. While roughly even shares of white Americans identified with both the Democratic and Republican Parties, identification with the Republican Party rose 5 percentage points and identification with the Democratic Party fell 6 percentage points by 2024. Over this time period, the share of white Americans who identified as Independents or chose not to affiliate rose slightly from 14.2 percent in 2012 to 17.7 percent in 2016, but returned to 14 percent in 2024.
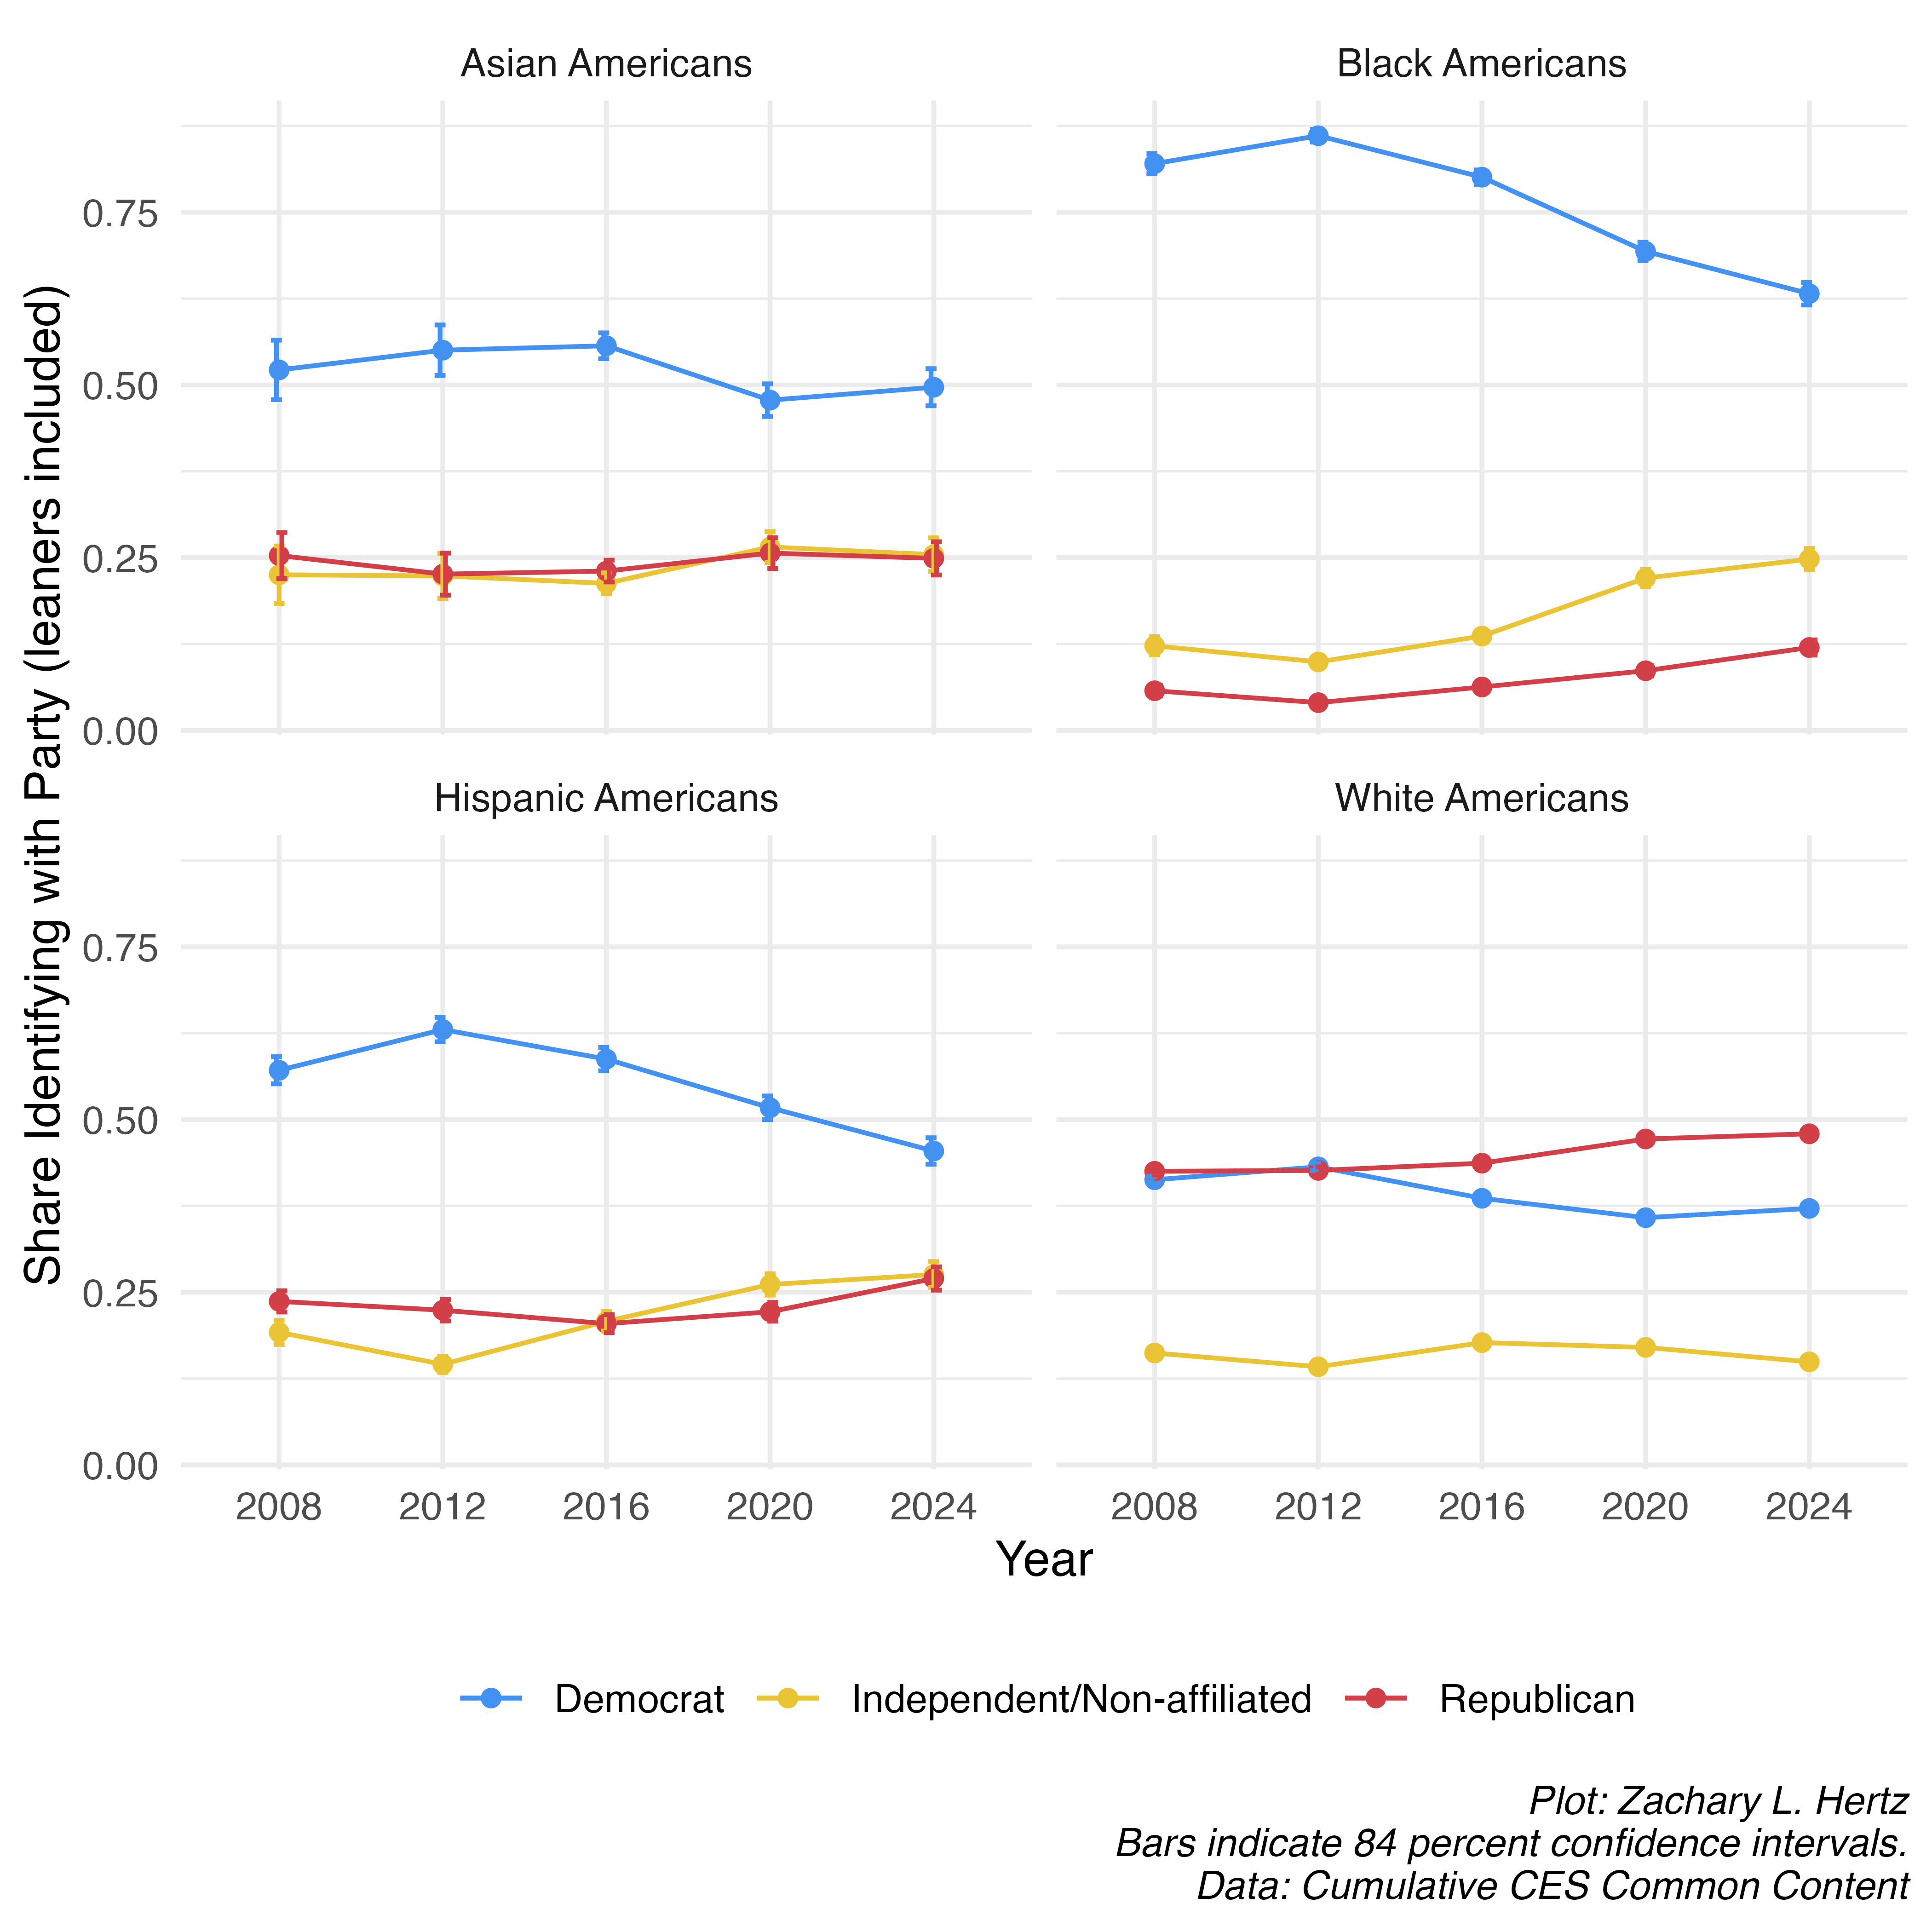
More than 50 percent of Asian Americans identified with the Democratic Party in 2008, and the share actually increased slightly to 55 percent in 20124 before dropping to 47.8 percent in 2020 and recovering slightly to 49.7 percent in 2024. The share of Asian Americans who identify as Republicans and the share of Asian Americans who identify as Independents or do not identify with either party is about evenly split and stable, hovering around 25 percent for the entire period.
4 Noting, of course, that there’s relatively wide error bars due to sample size constraints.
The share of Black Americans who identify with the Democratic Party peaked at 86 percent in 2012, but has fallen precipitously in every election since. In 2024, 63.2 percent of Black American adults identified with the Democratic Party. In the same period, the share of Black adults who identify with the Republican Party has tripled, from 4 percent in 2012 to 12 percent in 2024. The share of Black adults who identify as Independents or eschew partisan identification altogether has also risen steeply, from about 10 percent in 2012 to nearly 25 percent in 2024.
There was a similar decline in the share of Hispanic Americans who identify with the Democratic Party: in 2012, 58.8 percent of Hispanic adults identified as Democrats but in 2024 just 45.4 percent did. The share of Hispanic Americans who identify with the Republican Party has always been higher than the share of Black Americans or Asian Americans who identify with the GOP; despite this, Republican Party identification among Hispanic Americans rose 20 percent between 2012 and 2024, from 22.4 to 27 percent. The truly striking shift was among the share of Hispanic Americans who identify as Independents, which nearly doubled from 14.6 percent in 2012 to 27.6 percent in 2024.
Degree divide in Democratic Party affiliation widens further for Black and Hispanic Americans, with some mean reversion among white and Asian Americans
Has the declining share of Black and Hispanic Americans identifying with the Democratic Party been driven by a continuation of the emerging degree divide I wrote about in 2021? My updated plot shows that the answer is a conditional ‘yes.’
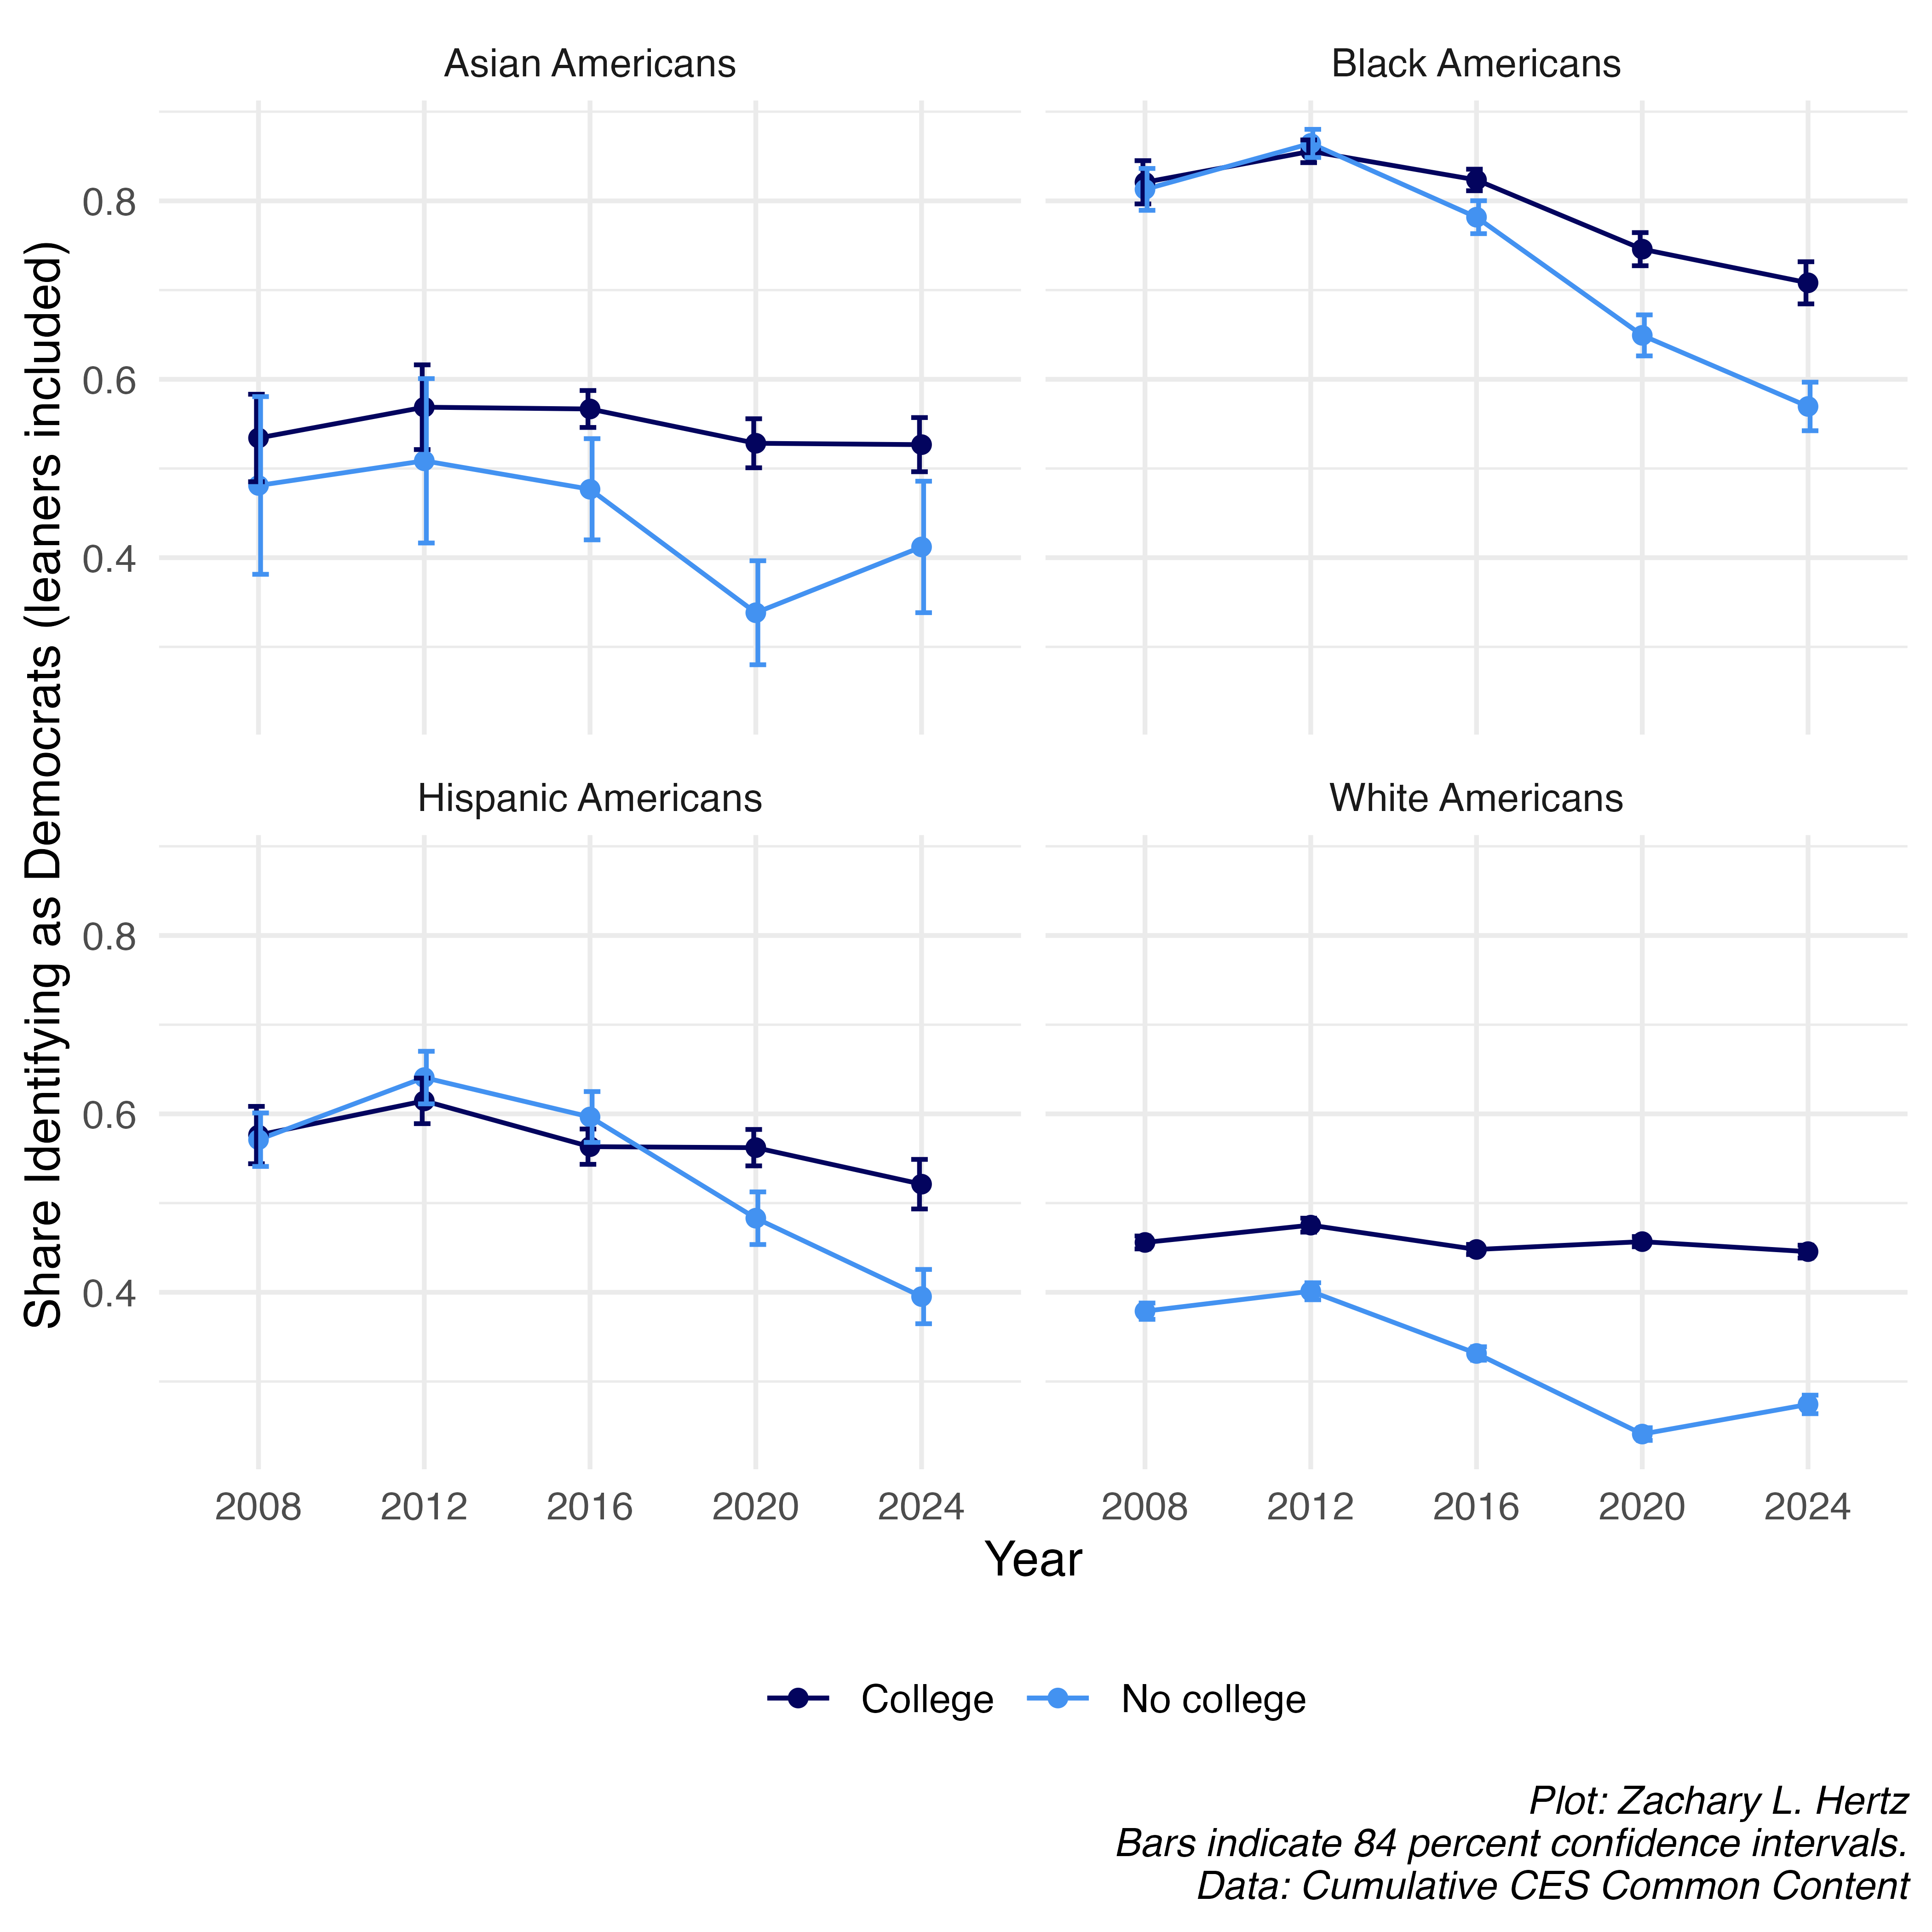
As I noted previously, there were no diploma divides in the share of self-identified Democrats in 2008 and 2012 for both Black Americans and Hispanic Americans; by 2020, however, as Democratic self-identification declined among those without a college education, education divides emerged and this trend continued into 2024. In 2024, there was a 12.6 percentage point difference in Democratic Party identification among Hispanic Americans with a college degree and those without one; there was also a 13.8 percentage point difference in Democratic Party identification among Black Americans with a college degree and those without one.
This trend is contrasted with Asian and white Americans, where educational divides already had appeared in 2012,5 widened in 2016 and 2020, but ended up receding a bit in 2024. They still persist, though: 52.7 percent of college-educated Asian Americans identified as Democrats in 2024, while 41.2 percent of Asian Americans without a degree identified with the same party, a 11.5 percentage point difference.
5 As I noted in 2021, the relatively small sample size of Asian Americans in the CES creates high uncertainty in the point estimates, so it remains important to caveat the educational differences in 2008 and 2012 among Asian Americans as not statistically significant. Still, in the following years these differences grew and following 2016 the difference in the point estimates for college-educated and non college-educated Asian Americans’ Democratic party identification are statistically significant.
Still no degree divide evident when it comes to Republican Party affiliation among non-white Americans, though 2024 saw a continued move to the party among Black and Hispanic Americans
There is strong evidence that Americans of all races without a college degree are increasingly less likely to self-identify as Democrats. But where are these people going, and are the patterns similar across racial groups? Again, I examine whether attrition in Democratic party affiliation among Americans without a college education is driven by switching to the Republican Party, or a general disaffiliation with the two major parties.
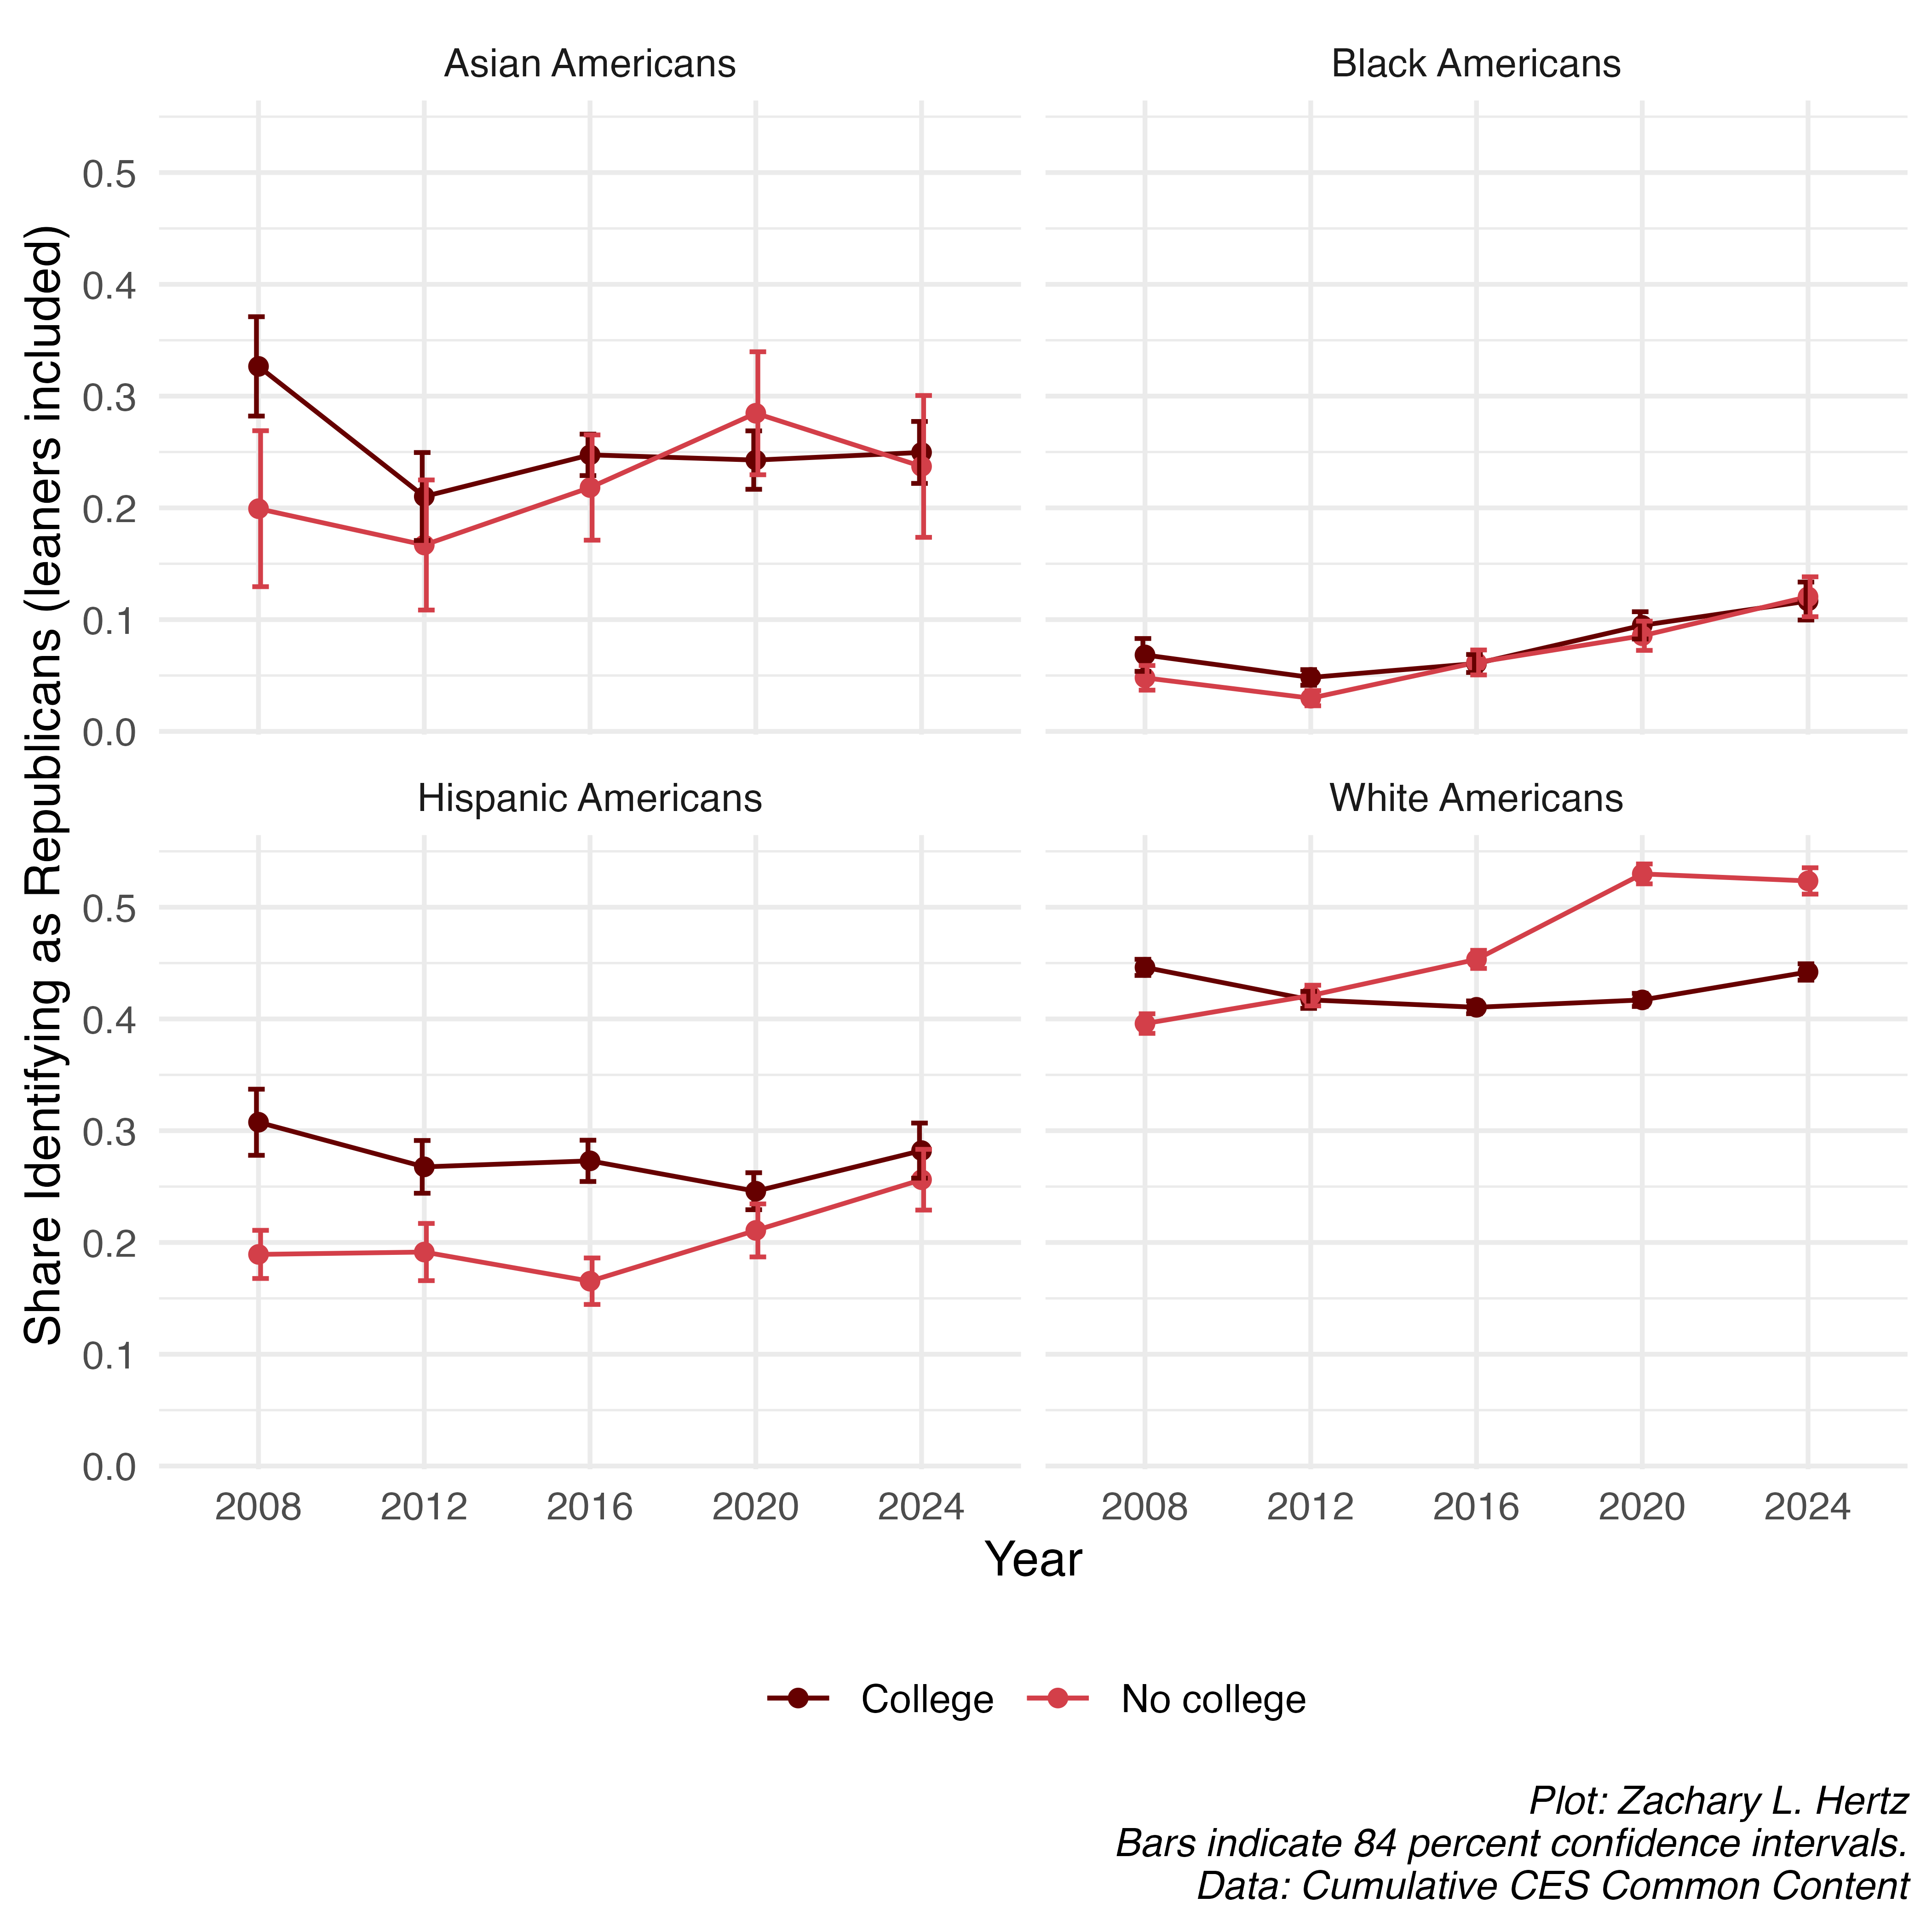
A few interesting updates emerge from including the 2024 data. First, while the 2008-2020 period generally saw a decline in Republic Party affiliation for Asian, Hispanic, and white Americans, 2024 saw an increase in Republican identification among college-educated Americans of all races.
Also notable is that while overall just 8.6 percent of Black Americans identify as Republicans, the share of Black Americans (both those with college degrees and those without college degrees) who identify as Republicans has been steadily increasing since 2012.
Hispanic Americans, meanwhile, had somewhat of an unusual pattern emerge. From 2008 to 2016, more college-educated Hispanic Americans identified with the Republican Party than Hispanic Americans without college degrees. In 2020, however, this gap narrowed as college-educated Hispanic Americans decreased slightly and non college-educated Hispanic Americans increased in Republican identification. In 2024, slightly higher shares of both groups identified with the GOP and the former diploma divide has become statistically insignificant.
The share of white Americans without a college degree who identify as Republicans remains much noticeably higher in the modern era than in 2008, at 52 percent, and as noted previously white Americans with a college degree increased in GOP identification between 2020 and 2024 by more than any other point since 2008.
Since 2012, there have been massive increases in the share of Black and Hispanic Americans without a college degree who identify as Independents
Here, my analytic decision to group Independent identifiers with people who do not identify with either the Democratic or Republican Party creates important differences from my 2021 analysis. Again, see the previous footnote6 for discussion on this decision.
6 I think this is defensible for a number of reasons, primarily because the question used allows people to identify as leaning towards the Democratic or Republican Parties. As a result, the remaining respondents have made pronounced and conscious decisions to not identify with either party. This leads to some small changes in results for later plots.
The attrition in the share of Hispanic and Black Americans with a college degree who identify with the Democratic Party seems to be driven somewhat by a large increase in identifying as Independents; these groups all increasingly identified as Independents between 2008 and 2024, by which nearly one in five Hispanic Americans with a college degree and one in five Black Americans with a college degree do not identify with either party.
Among non-white Americans without a college education, disaffiliation from both political parties is on the rise while appearing generally stable among white Americans. It is important to note that while the estimate for the share of Asian Americans without a college degree who identified as Independents seems to have increased between 2008 and 2024, the previously-mentioned sample size produces large standard errors and these differences can not be seen as statistically significant.
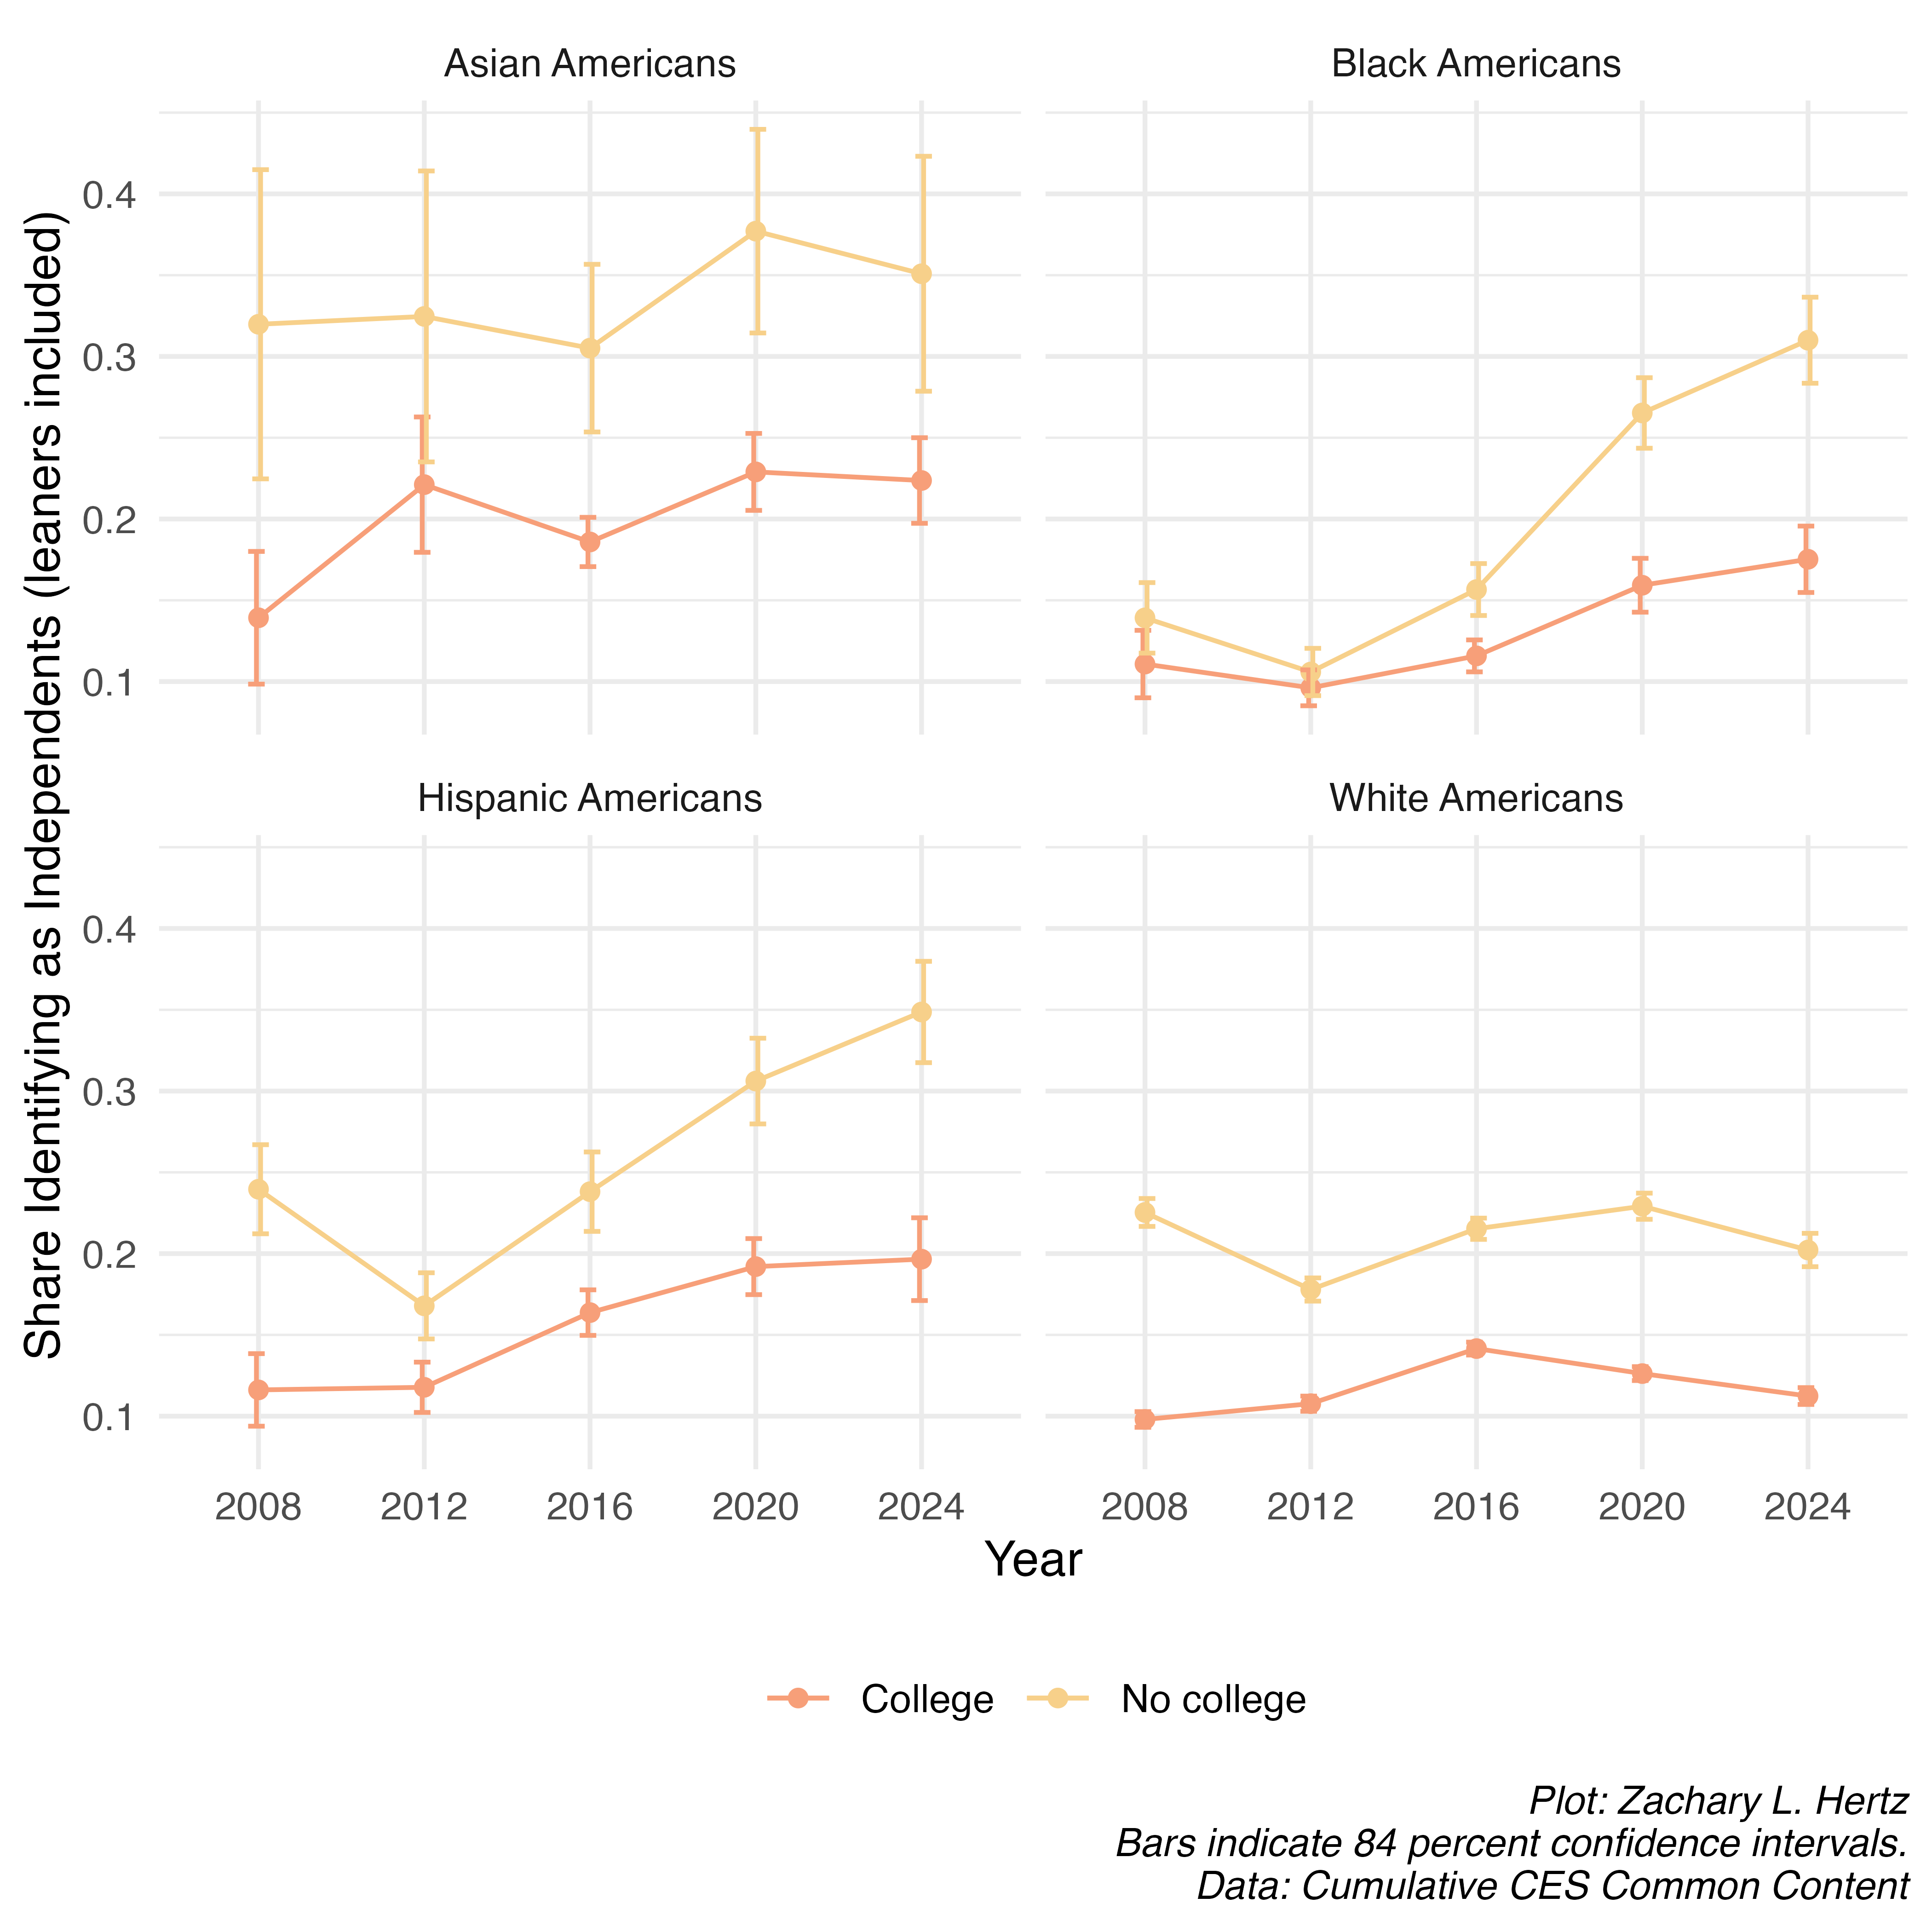
Again, these trends are remarkable for Black and Hispanic Americans without a college education. In 2008, just 13.9 percent of Black Americans without a college education identified as Independents or did not identify with the Democratic or Republican Party. By 2024, this had risen to nearly 31 percent — nearly one in three. Similarly, in 2012 about 17 percent of Hispanic Americans without college degrees did not identify with one of the two major political parties. By 2024, this number nearly doubled to 35 percent.
Educational polarization in vote choice is still driven by nonhispanic whites…for now
As before, if you believe politics is for power then you might care less about party identification than actual vote choice. To do this, I use validated voters in the CES and their survey responses to the presidential vote choice question. Splitting presidential support for Democratic candidates by race and education over the 2008 to 2024 period leaves us with some interesting findings in an update from 2024.
While between 2008 and 2020 there appeared to be little variation in Hispanic support for the Democratic presidential candidate by education, for the first time the Democratic candidate won a smaller share of Hispanic Americans without a college degree than Hispanic Americans with a college degree, though we cannot conclude that the difference is statistically significant.
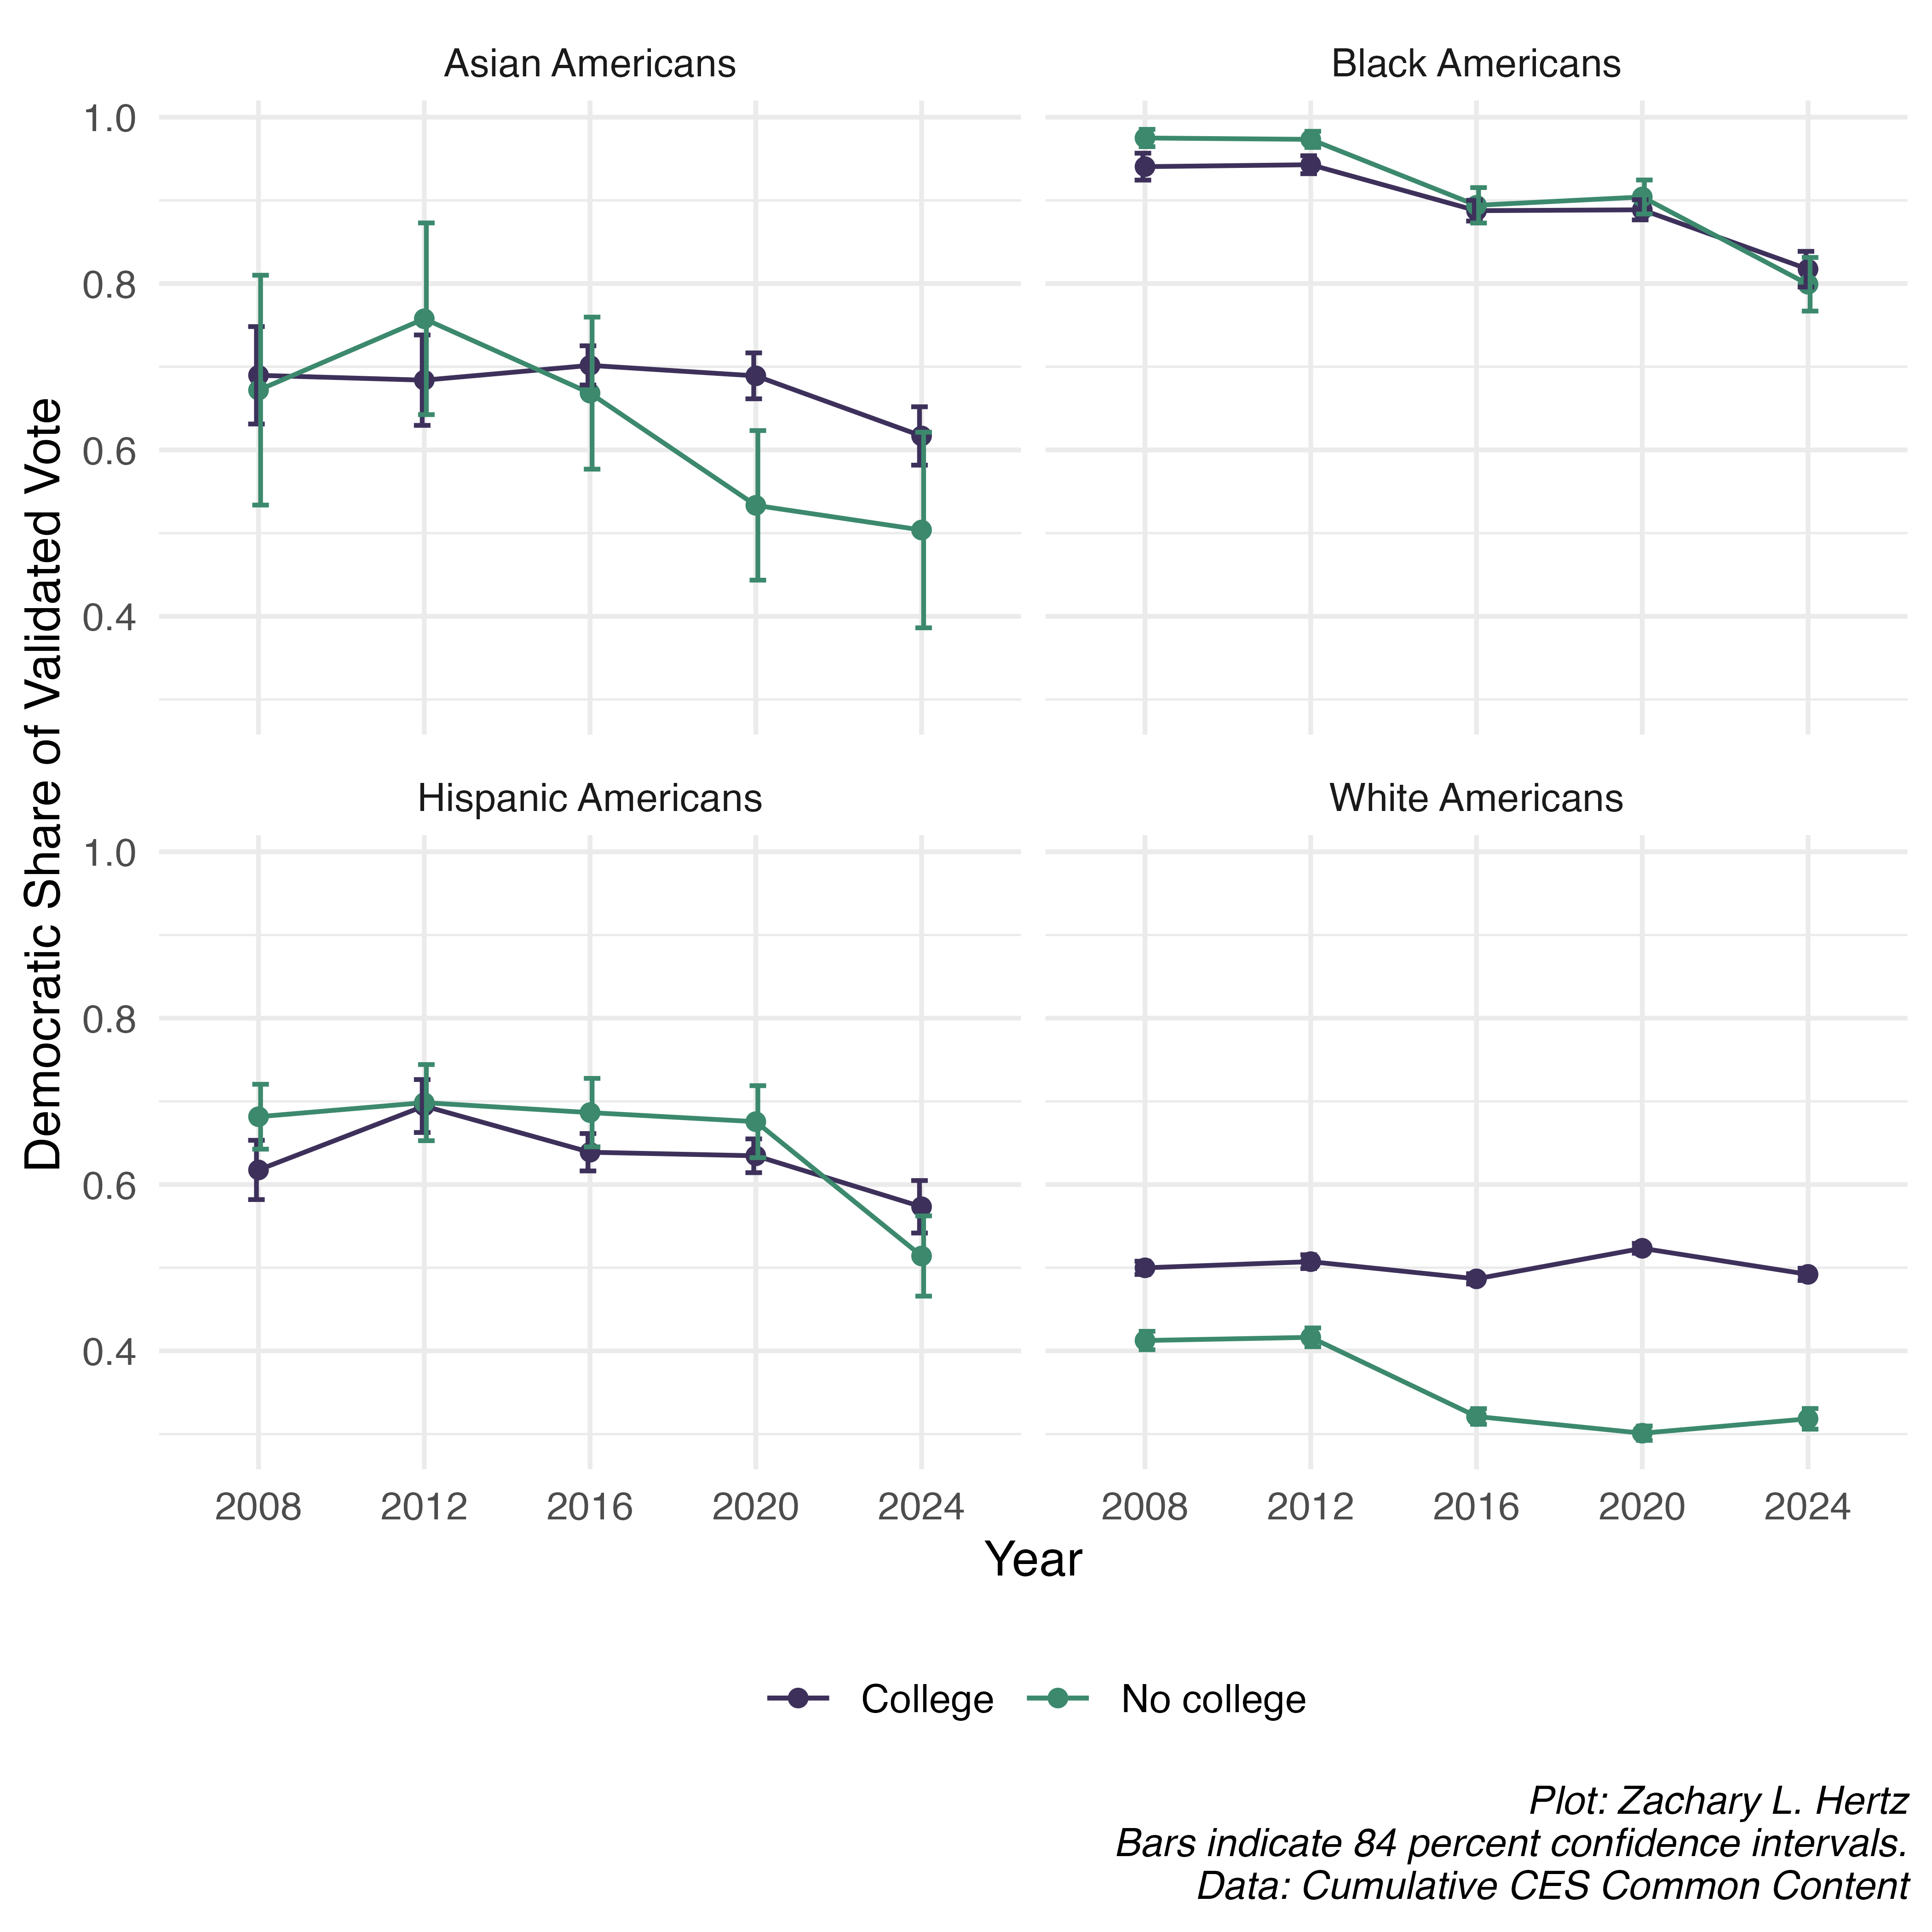
Another interesting update is that while 2020 marked a slight and statistically significant drop in Democratic support from 2012 for Black Americans, 2024 marked a rapid erosion in Democratic support that exceeded the decline from the previous eight years. This drop was equally pronounced along educational lines.
Again, due to large error bars I hesitate to make strong conclusions about the patterns observed among Asian Americans’ vote choice in the CES when broken out by education, but I note that the education gap that emerged in 2020 appeared to hold in 2024.
Finally, we also note an interesting and slight reversion to the mean among non-hispanic white Americans, who are frequently cited as the drivers of educational polarization. The Democratic vote share among college-educated whites dropped about 3 percentage points while the vote share among whites without a degree rose about 2 percentage points, closing what was previously a 22 percentage point gap by five percentage points.
Considering vote intent (including nonvoters) suggests educational polarization has affected vote choice
One analytical trick that the CES allows us to do is to consider vote intent. Because the CES is a survey, it includes data on the preferred candidates for individuals who never showed up to vote. I reprise the previous plot, this time including responses from non-voters. Suddenly, we can see that a sharp educational polarization in vote preference among nonwhite Americans began in 2020 and intensified in 2024.
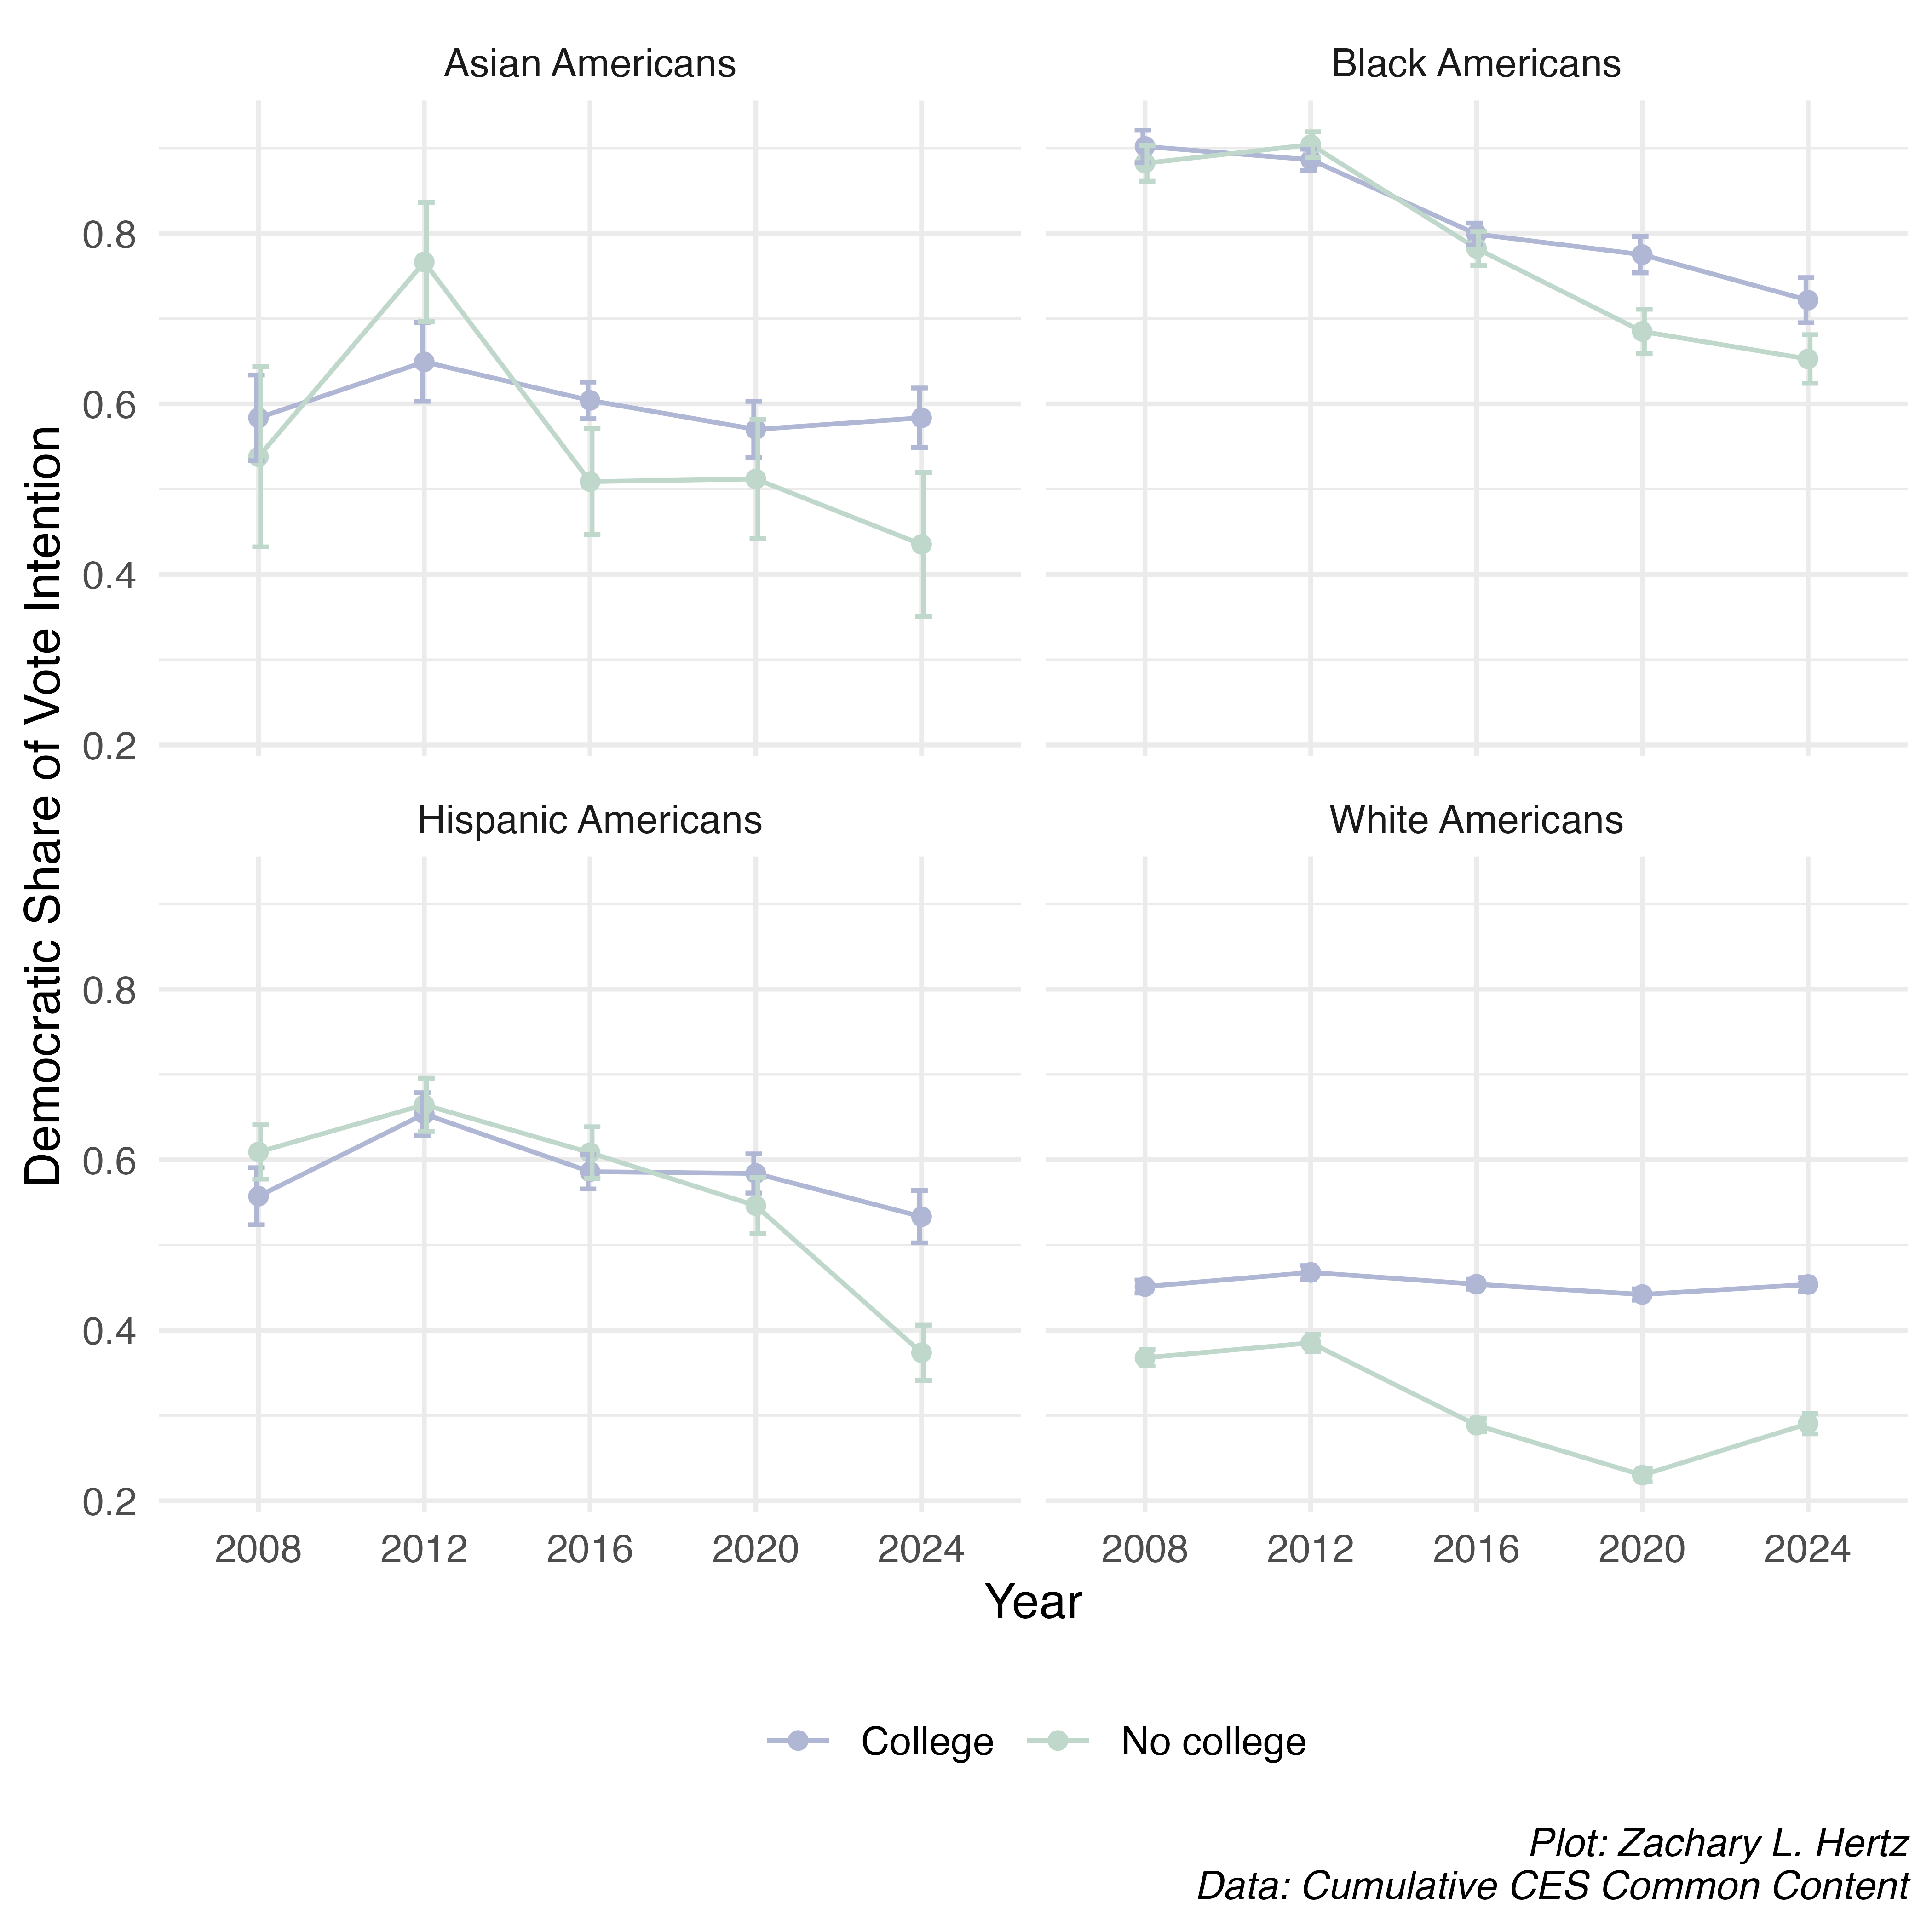
This analytical move is sharpest for Hispanic Americans; in 2016 and even 2020 there was not much of a difference in Democratic vote preference between those with college educations and those without. By 2024, though, there was a nearly 16 percentage point diploma divide in the Democratic vote preference among Hispanic Americans. Similarly, in 2016 about 80 percent of Black Americans, both with and without a college degree, intended to vote for Democrat Hillary Clinton for president. In 2020, 77.5 percent of Black Americans with a college degree intended to vote for Joe Biden while 68.5 percent of Black Americans without a college degree intended to vote for him, marking about a 9 percentage point diploma divide. This gap narrowed to 7 percentage points in 2024, but persisted.
Conclusion
There appear to be growing educational divides in party identification among Americans of all races, with the trends accelerating significantly between 2020 and 2024. Most notably, Democratic Party identification has declined precipitously among Black and Hispanic Americans without college degrees, falling to historic lows by 2024. While this educational gap in Democratic affiliation has widened dramatically for these groups, it has actually narrowed somewhat among white and Asian Americans.
The key finding is that Americans without college degrees across all racial groups are moving away from the Democratic Party rather than toward the Republican Party. Black and Hispanic Americans without college degrees are increasingly identifying as Independents or choosing not to affiliate with either major party, with nearly one in three Black Americans and more than one in three Hispanic Americans without degrees now falling into this category.
For the first time since these trends began, there are signs that educational polarization may finally be emerging in actual vote choice among non-white Americans, particularly Hispanic voters. When including vote intent from non-voters, the educational divides become even more pronounced, suggesting these shifts in party identification may be precursors to broader changes in electoral behavior.
These patterns represent a fundamental realignment in American political coalitions. The Democratic Party’s traditional strength among voters of color is increasingly concentrated among college-educated members of these communities, while non-college-educated Americans of all races are becoming more politically homeless—disaffiliating from both major parties rather than switching allegiances. Understanding and responding to this trend of political disengagement will be crucial for both parties’ future electoral prospects.
Citation
@online{lorico_hertz2025,
  author = {Lorico Hertz, Zachary},
  title = {Revisiting “{Educational} {Polarization:} {A} {White}
    {Phenomenon?}” In the {Wake} of the 2024 {Election}},
  date = {2025-08-22},
  url = {https://zacharylhertz.github.io/posts/2025-08-22-educational-polarization-redux/},
  langid = {en}
}