Truth Hertz
This blog tracks a number of short data-driven posts I have written over the years analyzing survey data, methodology, and electoral trends. I may also throw other musings here when I have the time to neglect my research.

Proof Advice and Strategies for Political Scientists
game theory
formal models
proofs
Revisiting “Educational Polarization: A White Phenomenon?” in the Wake of the 2024 Election
electoral analysis
R
CES
educational polarization
racial polariation
college education
In WAR, There Are No Winners But All Are Lou-sers
electoral analysis
R
Census data
Asian Americans
turnout
Congress
race and ethnicity
What Can Survey Data Tell Us About Ideological Differences Between Black Voters and Black Nonvoters?
electoral analysis
R
CES
Black Americans
turnout
race and ethnicity

Creating Survey Weights in R Using Census Data
R
tutorial
survey
tidyverse
survey data
ACS
Census

How Sensitive are Partisans to Out-Party Cues?
R
party cues
elite cues
partisan polarization
policy learning
Educational Polarization: A White Phenomenon?
electoral analysis
R
CES
educational polarization
racial polariation
college education
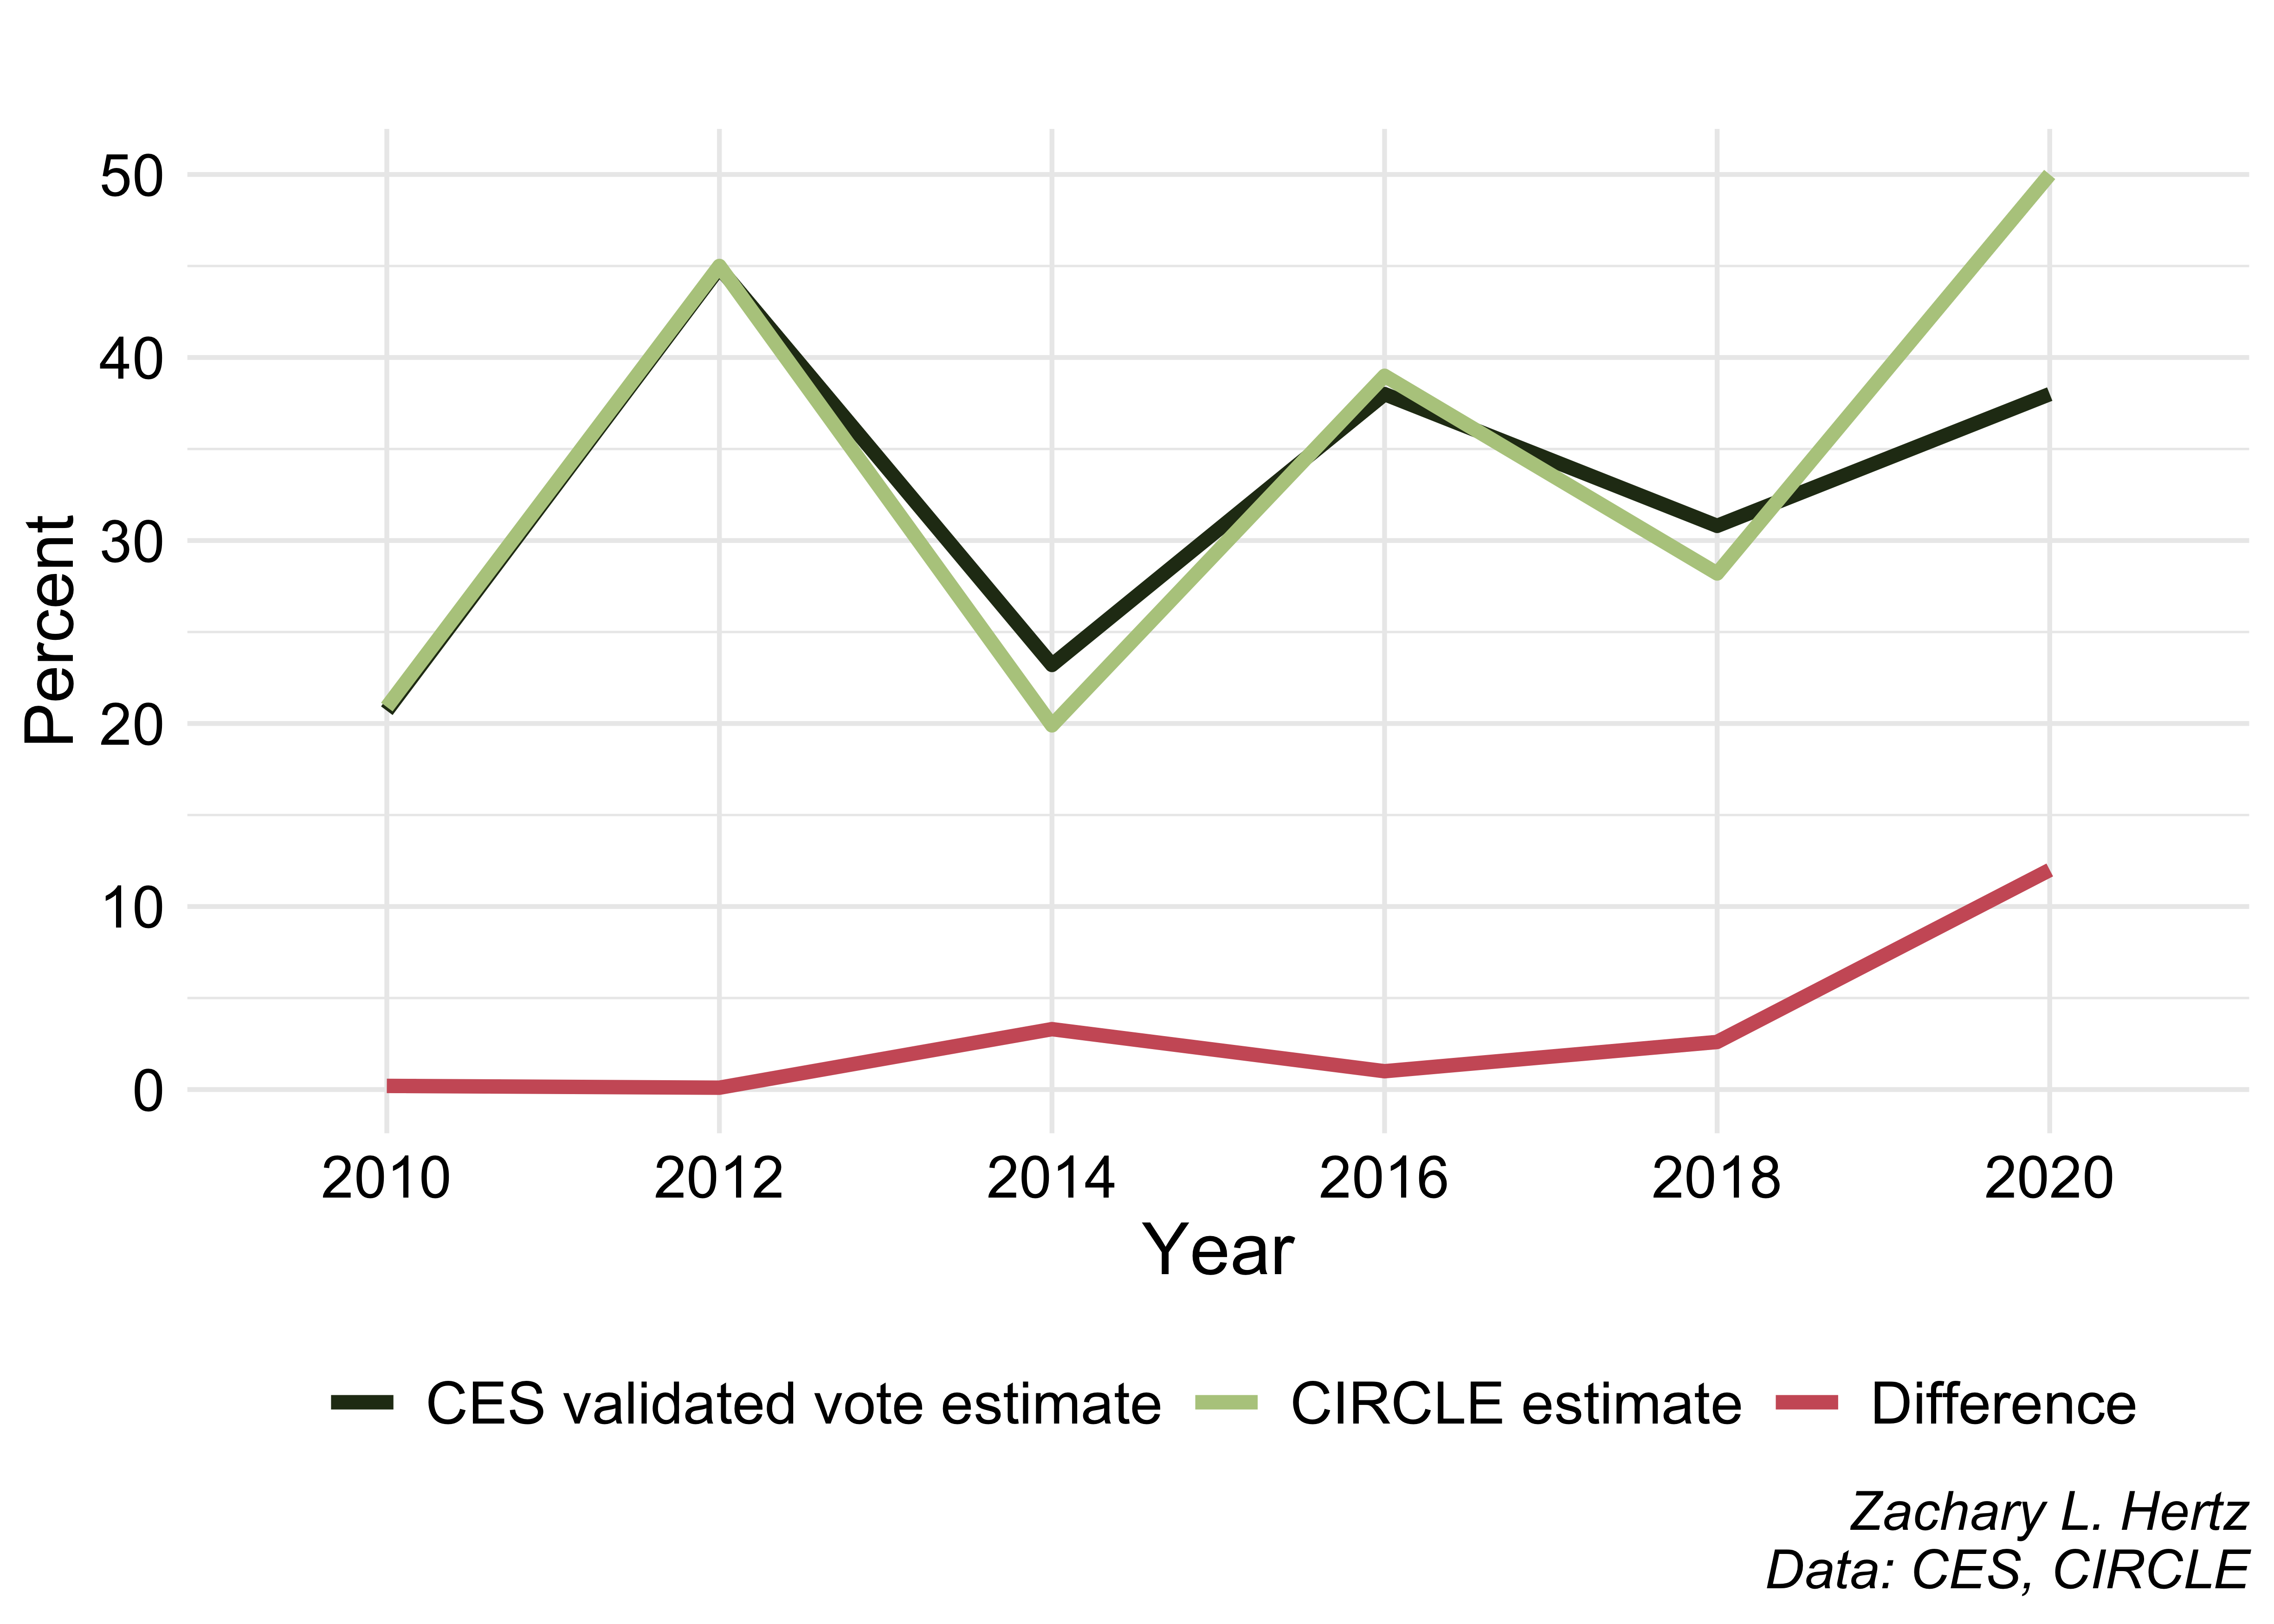
Estimates of Youth Turnout Have Recently Diverged
R
CES
CIRCLE
youth voting
voter turnout
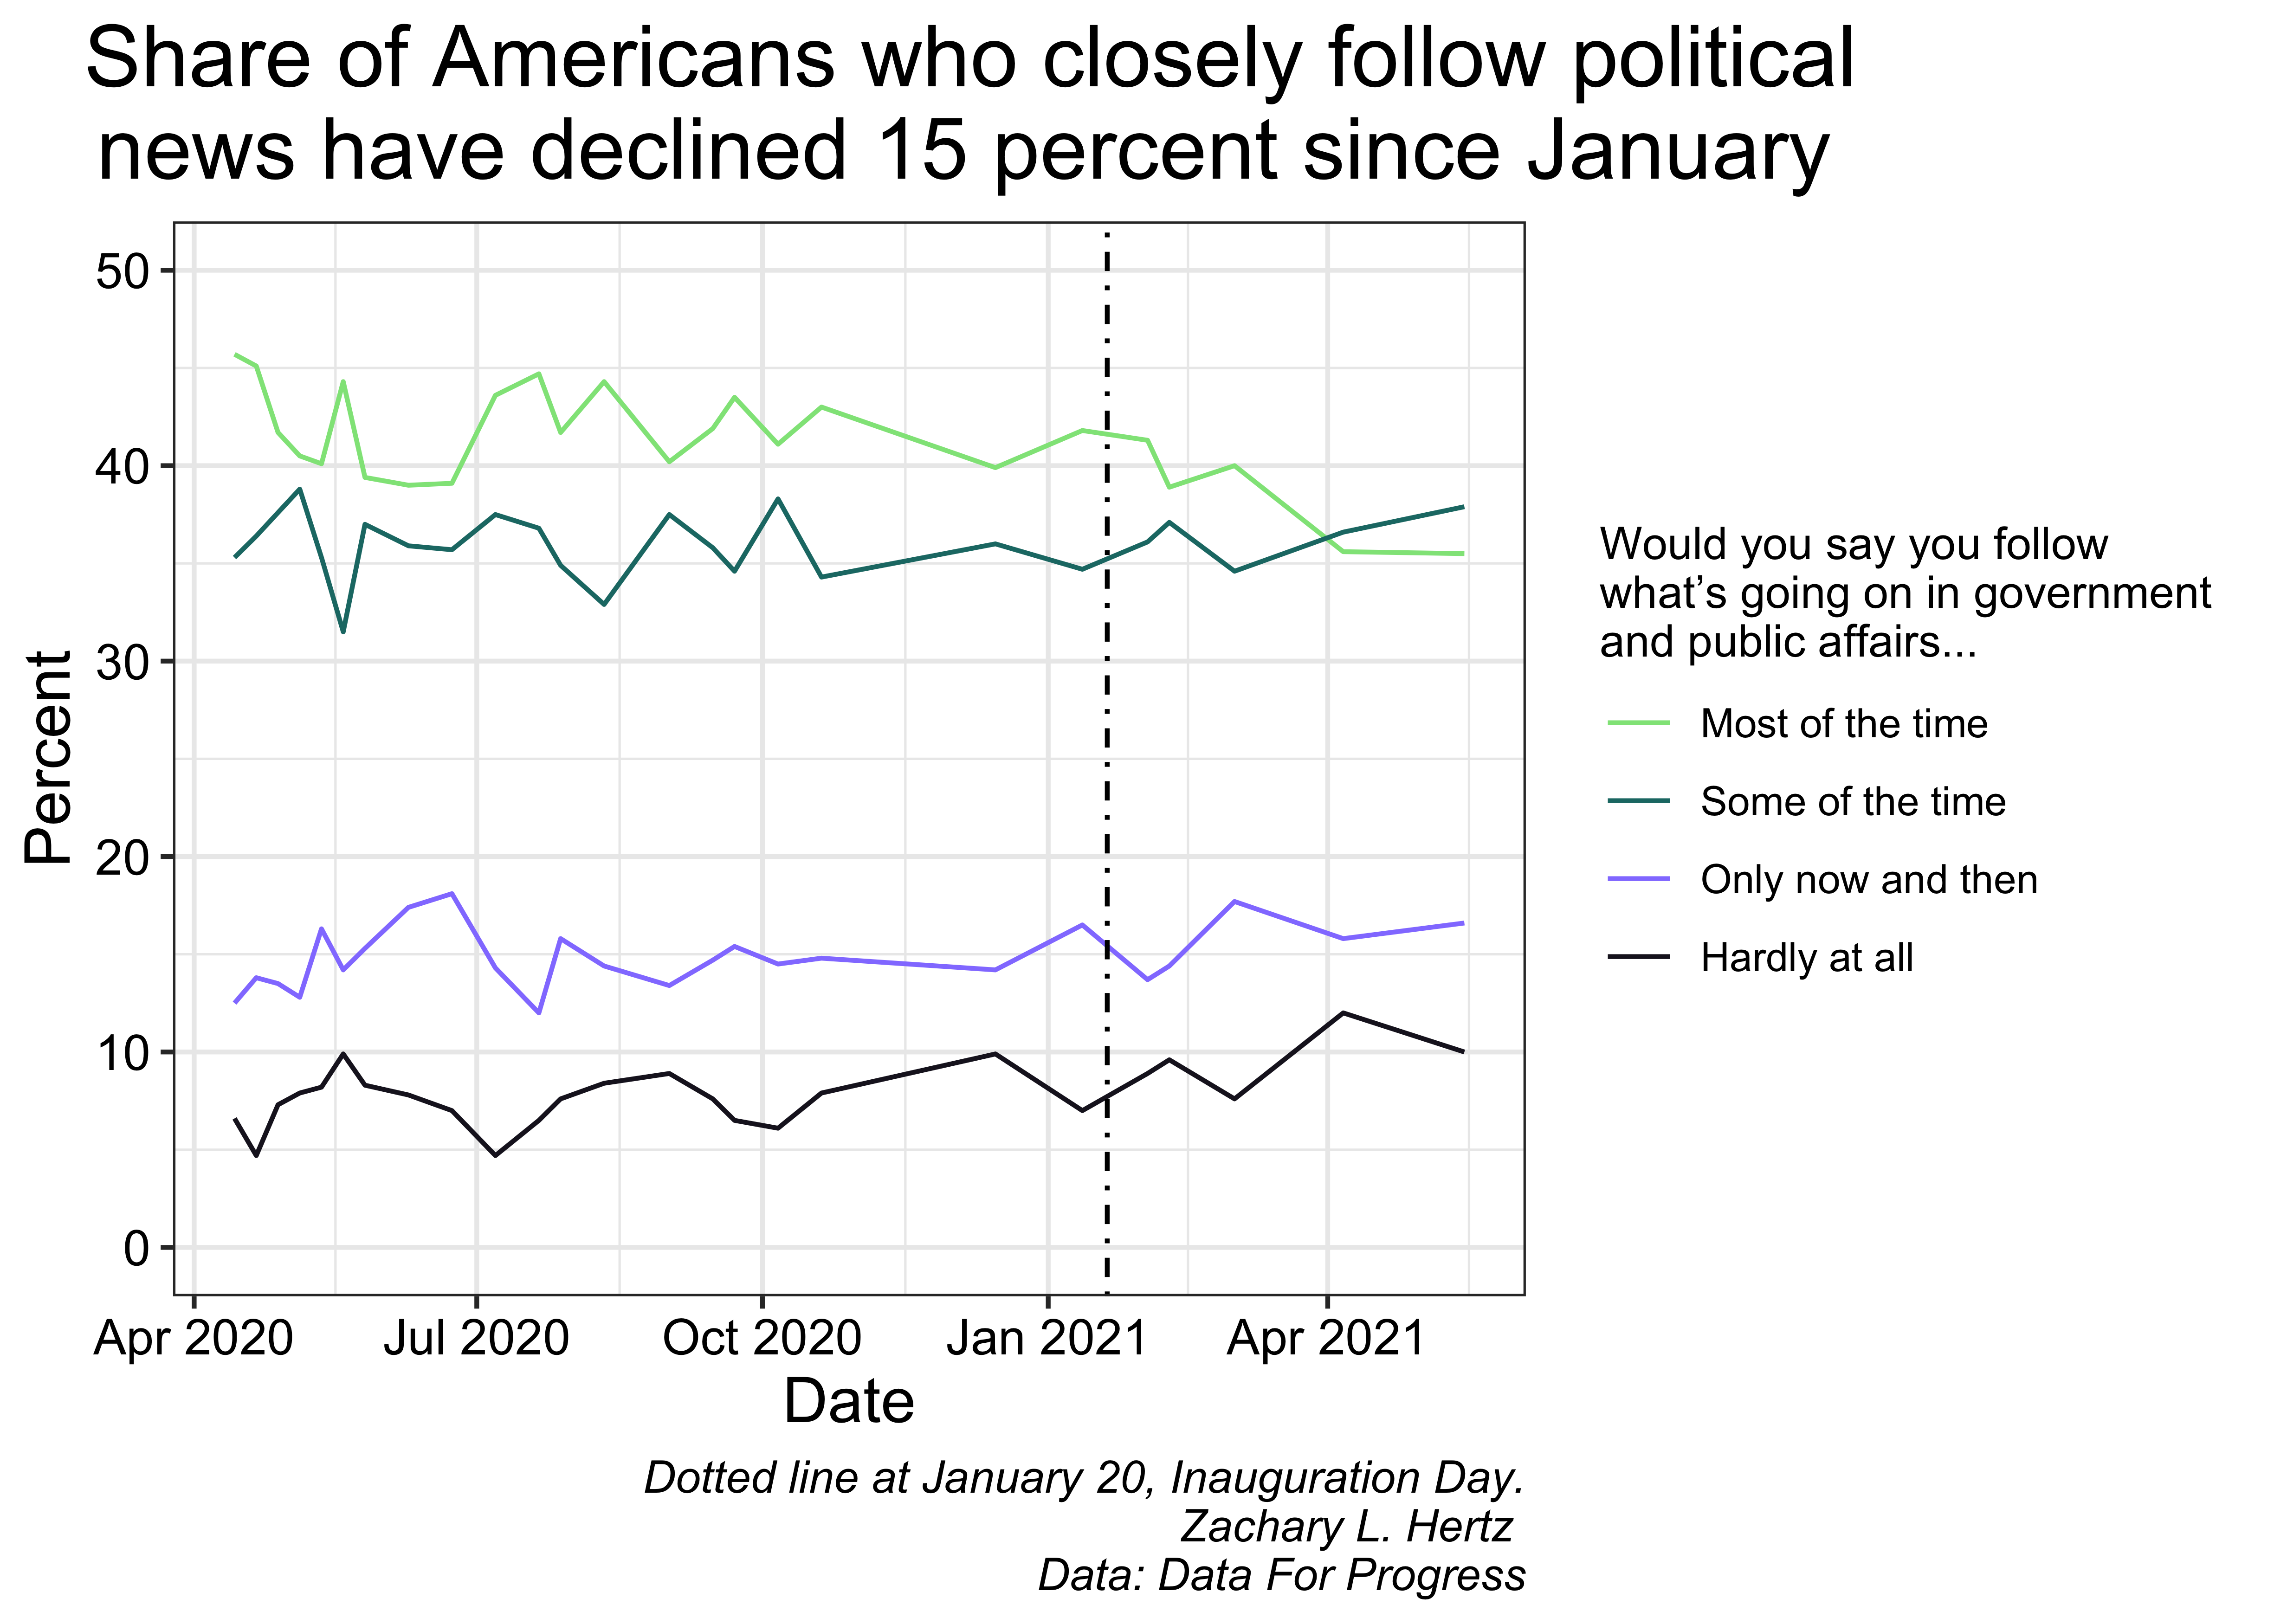
Tracking the Drop in News Interest
R
voter analysis
news interest
media attention
survey data
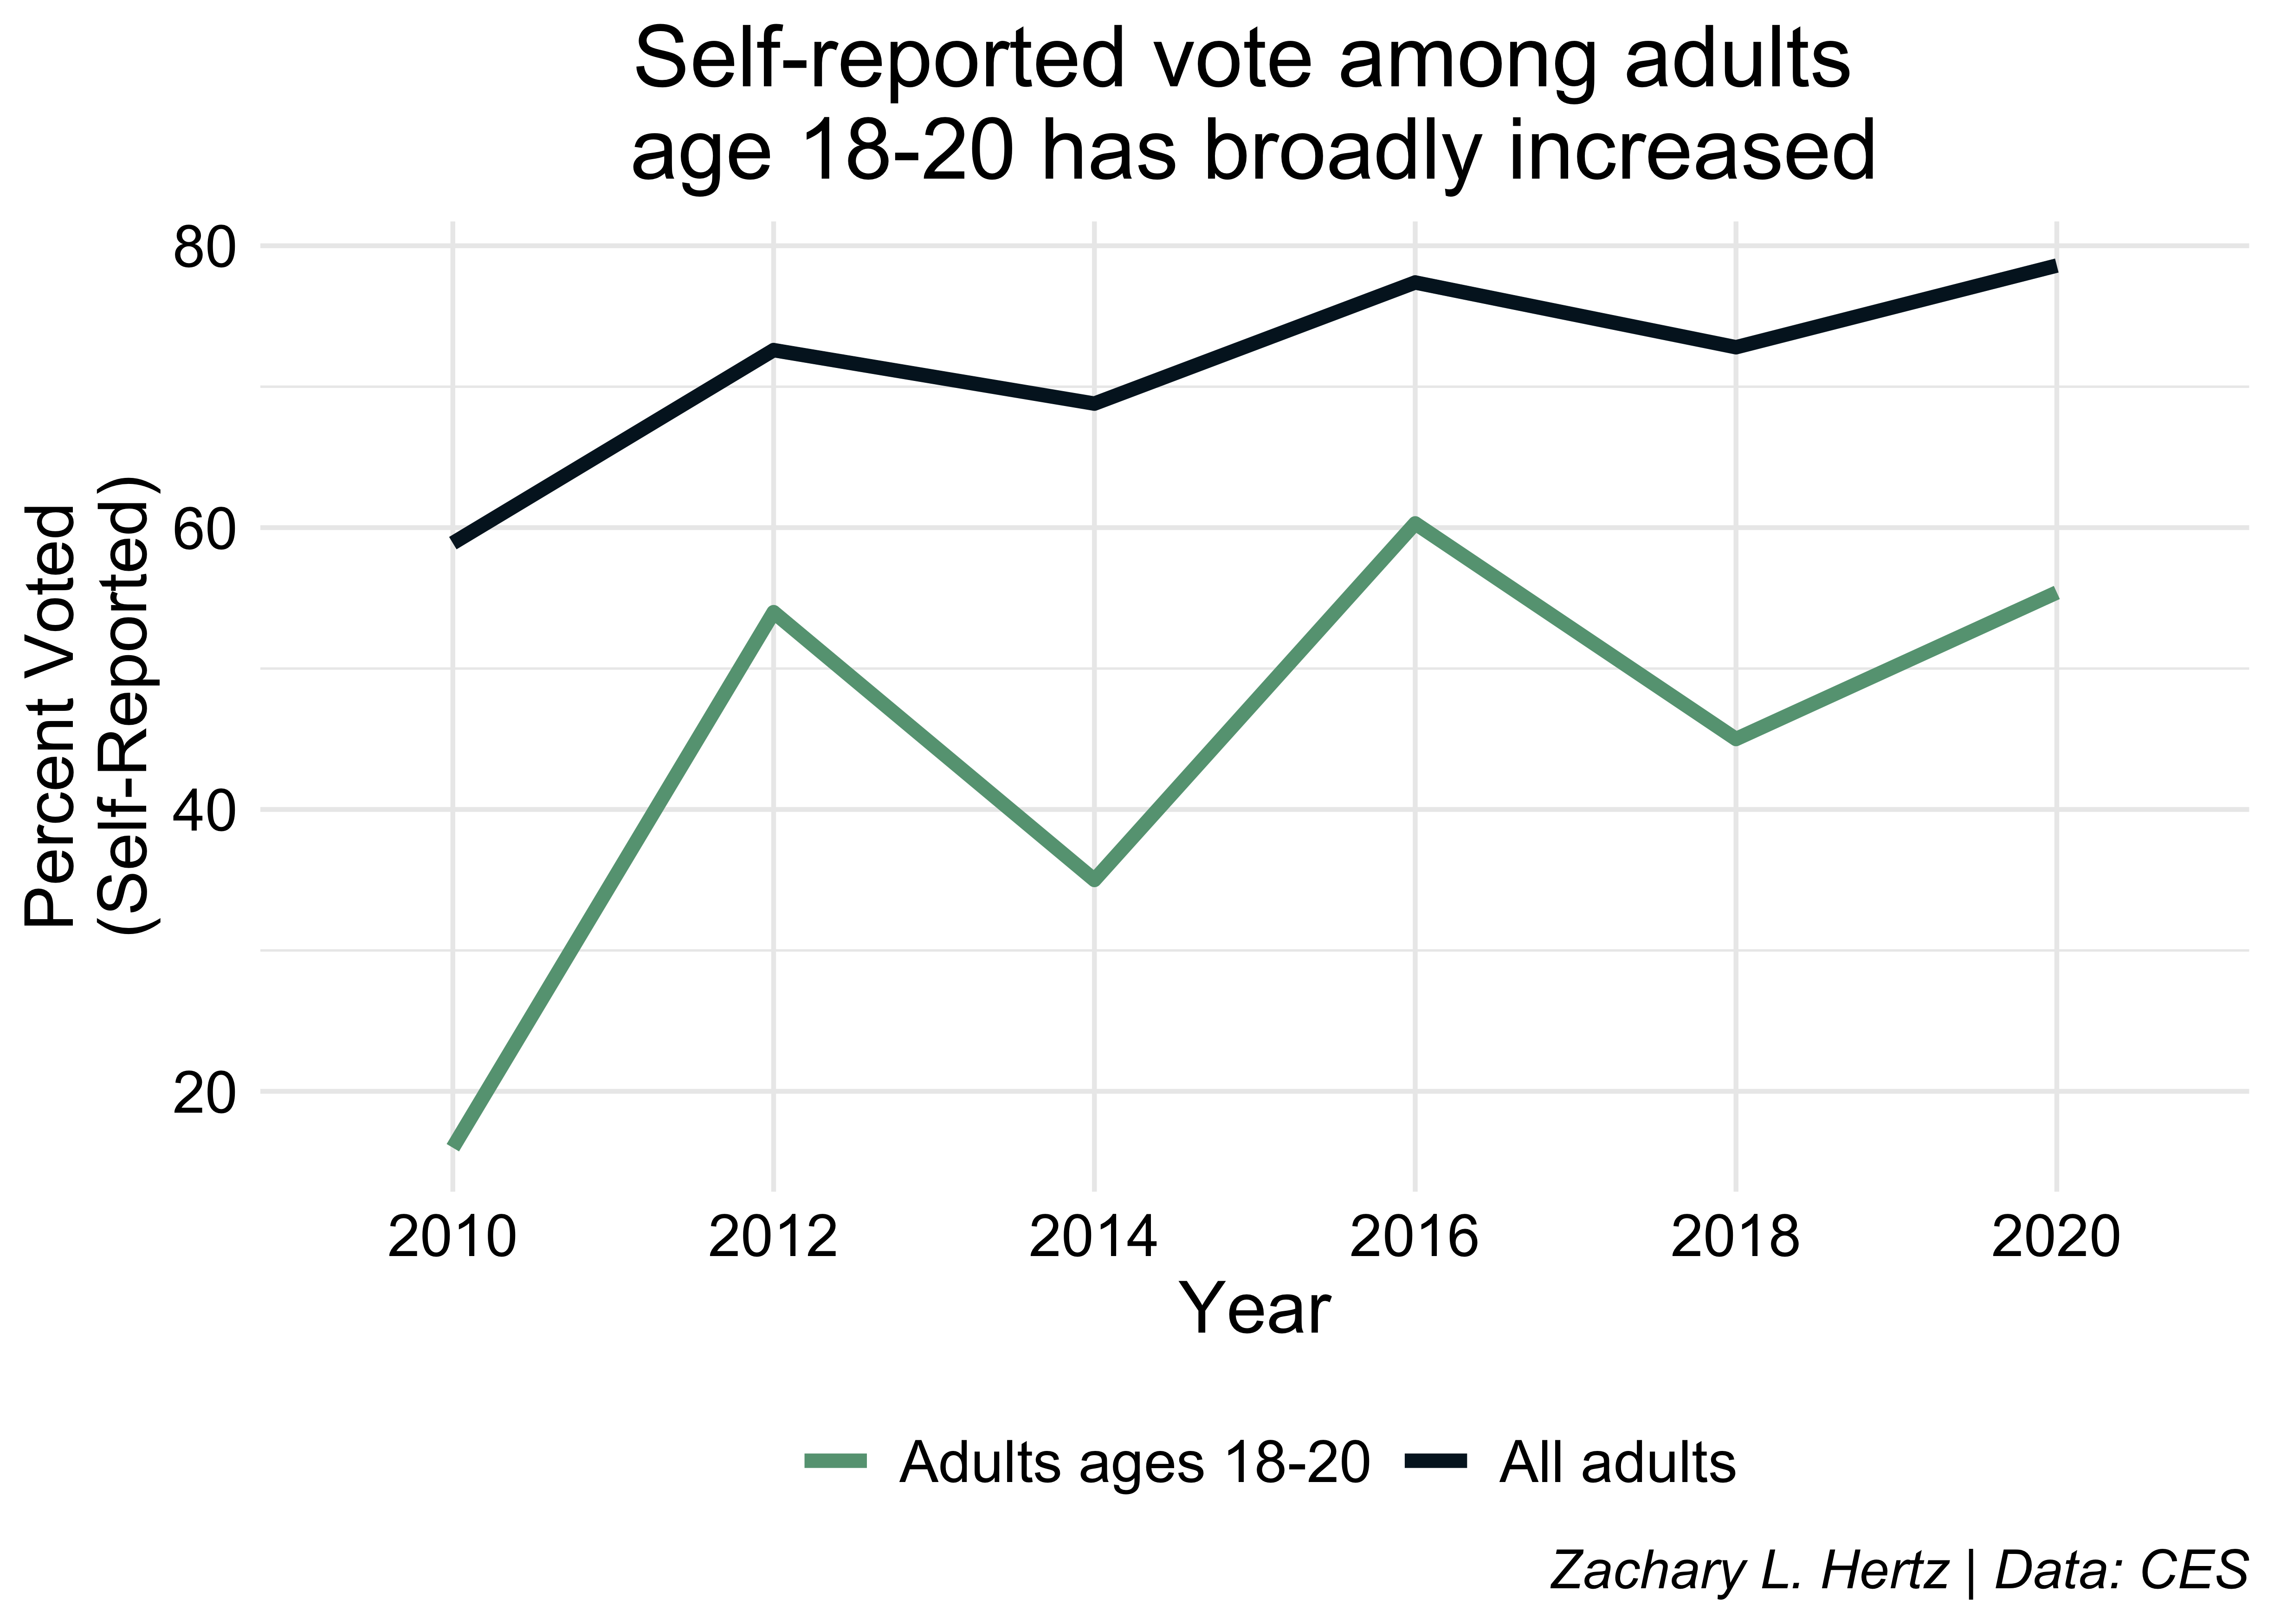
Using the CES to Examine Young Voters
electoral analysis
R
CES
CIRCLE
youth voting
voter turnout
An Introduction to Using the {survey} Package in R
R
tutorial
survey
tidyverse
survey data
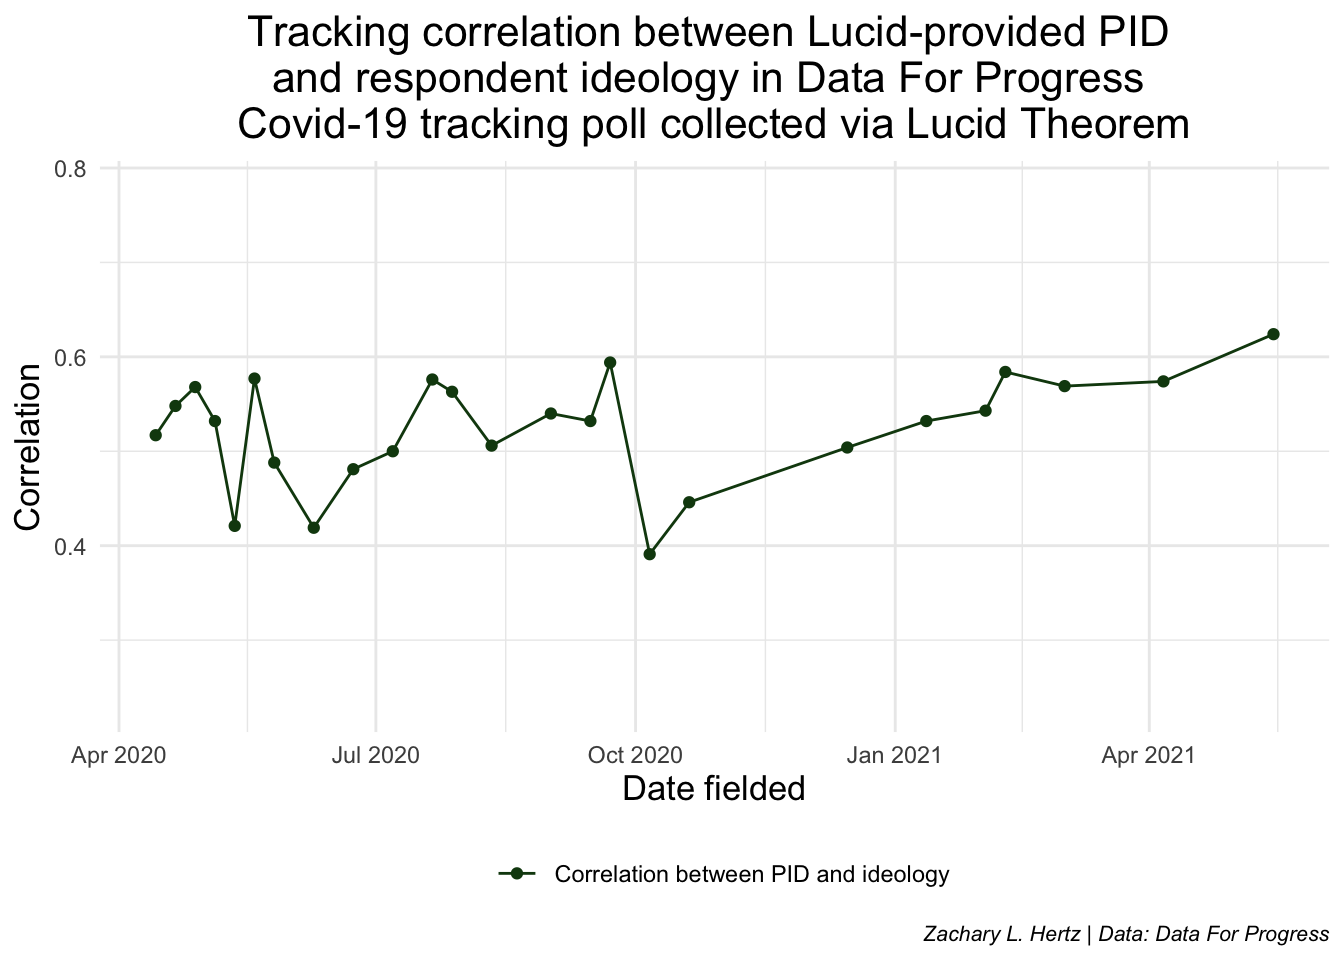
Investigating Concerns about Lucid Theorem Data Quality
survey methodology
Data For Progress
Lucid
No matching items